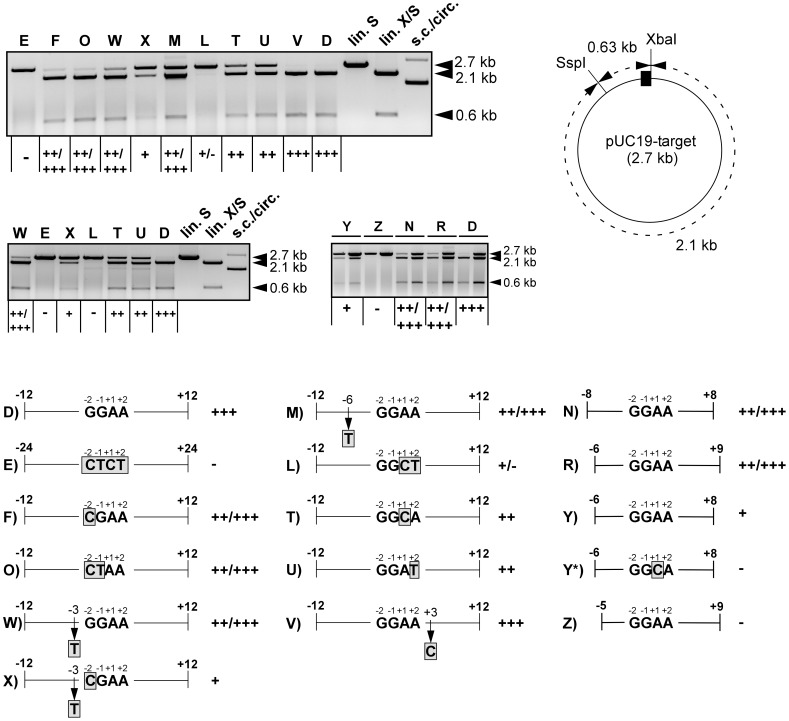
Figure 3. Analysis of the I-UmaI target site specificity.
CF from induced pAP2 cells was incubated with various substrate plasmids under standard conditions for analysis of cleavage efficiencies (see Materials and Methods). Letters denote the individual substrate plasmids (e.g. D for pUC19-D). Reaction products were additionally cleaved with SspI to yield 2.1 and 0.63 kb fragments in case of cleavage (schematic on the right: the I-UmaI target site fragment is indicated as black box. XbaI cleaves at the right border and in combination with SspI produces fragments similar in size to those produced by I-UmaI/SspI). Marker lanes: lin. S, pUC19-D cleaved with SspI; lin. X/S, pUC19-D cleaved with XbaI/SspI; s.c./circ., uncleaved pUC19-D showing the supercoiled and circular forms. The + and - symbols refer to the cleavage efficiencies. +++, complete cleavage; ++/+++, >50% cleavage; ++, ∼50% cleavage; +, <50% cleavage; +/−, faint cleavage bands were detected; -, no detectable cleavage. The double lanes in the lower panel on the right refer to two different substrate concentrations used: for the right lane, the concentration was 3.3-fold higher than normally used. Note the inefficient cleavage of pUC19-Y. The schematic (bottom) shows the lengths and substitutions (boxed, shaded gray) of the tested constructs. Numbers refer to the positions within the target site as indicated (see Table 1).

