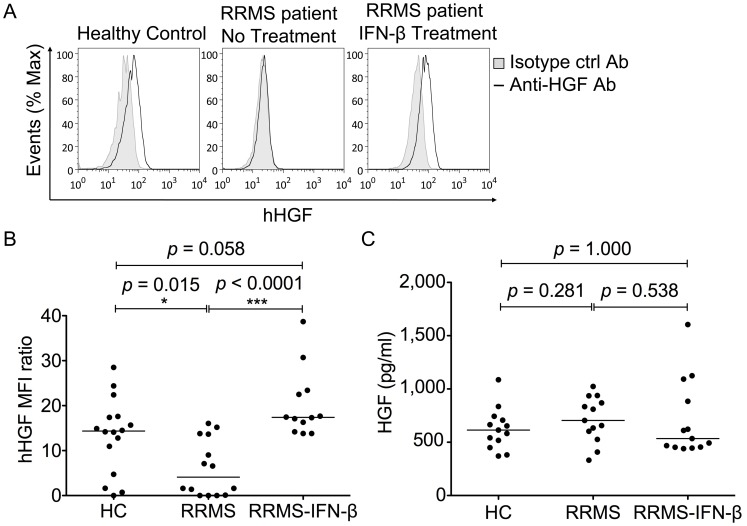
Figure 5. IFN–β–treatment increased levels of cell–associated HGF in monocytes from RRMS patients.
(A) Flow cytometry for HGF was performed on CD14+ monocytes from the three groups (healthy control, untreated RRMS patients, and IFN–β−treated RRMS patients). Monocytes were stained for surface CD14 antigen and cell–associated HGF. Data show representative histogram overlays of isotype (filled histogram) and HGF–stained cells (unfilled histogram). (B) Cell-associated HGF levels in CD14+ cells were higher in healthy controls and IFN–β–treated RRMS patients. Surface expression was measured by flow cytometry and calculated as the mean corrected fluorescence index (MFI) ratio. Background HGF expression was assessed by measuring the fluorescence of cells incubated with a nonspecific isotype control antibody similarly labeled. The MFI for control anti–HGF antibody isotype staining was divided with the HGF MFI of monocytes. (C) Median serum HGF levels were similar in all three groups. ELISA for HGF was performed on sera from the three groups (healthy control, untreated RRMS patients, and IFN–β−treated RRMS patients). For both monocyte and serum HGF level analysis, each circle represents a single individual and the lines show the medians. Difference in median levels between groups was examined by Kruskal-Wallis test followed by Mann-Whitney U test due to a non-Gaussian distribution of values. *, p<0.05 and ***, p<0.001.

