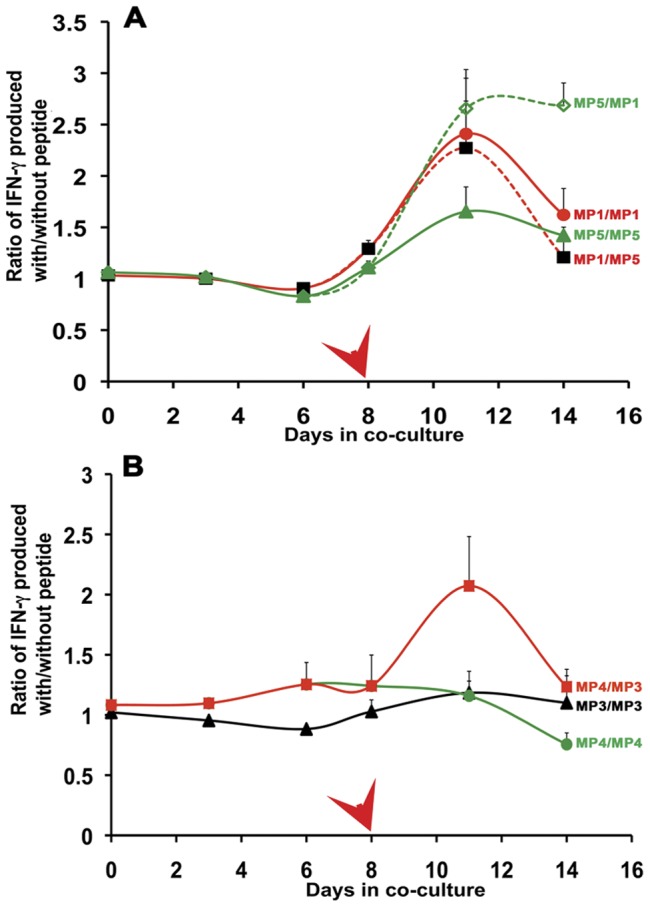
Figure 5. Cross-stimulation of CD14- cells by mimic peptides.

CD14− cells were incubated with DCs loaded with mimic peptides and then re-stimulated with a fresh batch of DCs loaded with same or a different mimic peptide. T-cell stimulation was monitored by quantifying the amount of IFN-γ released into the medium. The IFN-γ levels were normalized to the levels produced following incubation with DCs that had no peptides loaded. Error bars represent the normalized % error from two independent experiments. The combination of peptides are indicated in the figure and are as follows A. MP1 followed by MP1; red solid line (•), MP1 followed by MP5; red dashed line (▪), MP5 followed by MP5; green solid line (▴) and MP5 followed by MP1; green dashed line (⋄). B. MP3 followed by MP3; black solid line (▴), MP4 followed by MP4; green solid line (•), MP4 followed by MP3; red solid line (▪).
