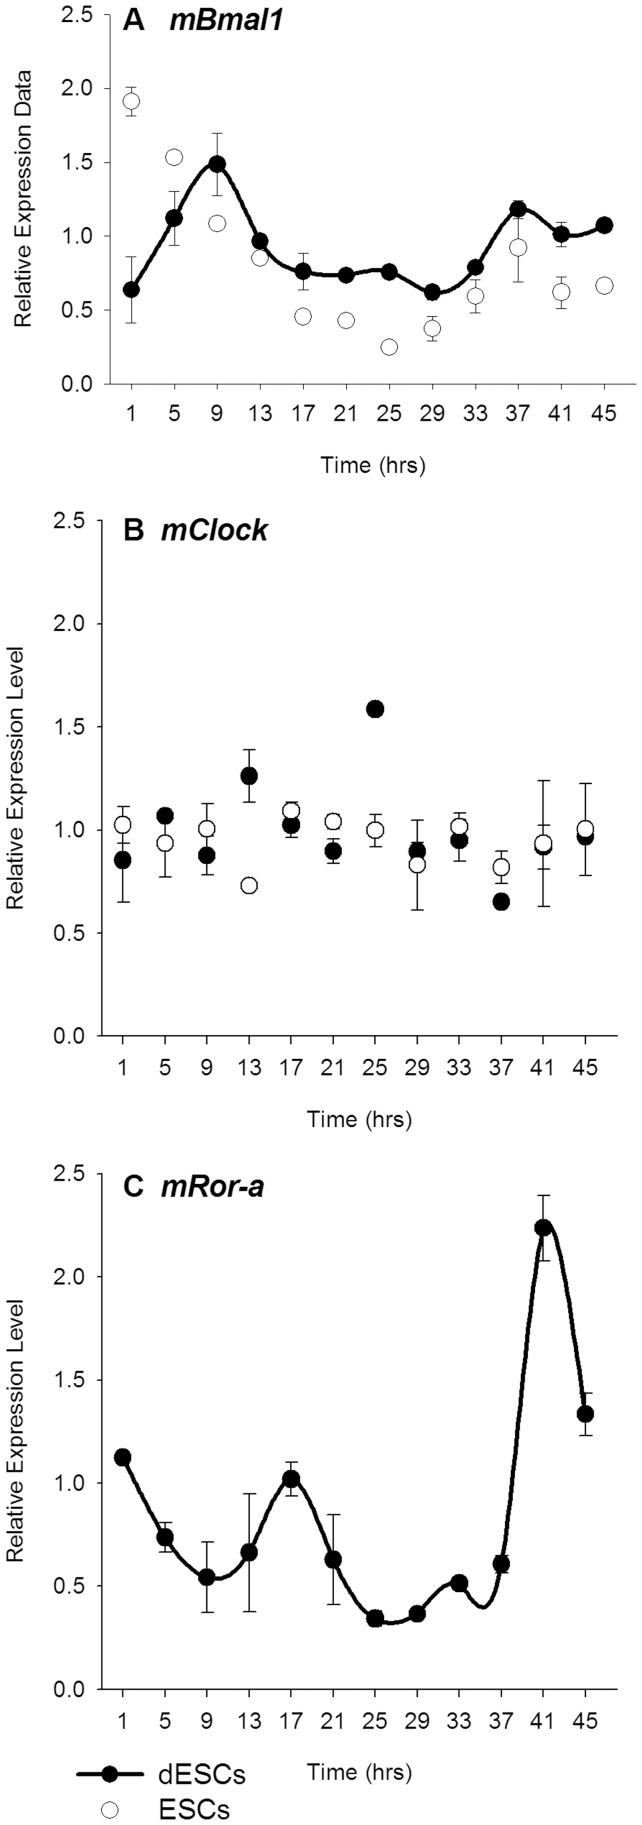
Figure 3. Positive elements of the molecular clock are arrhythmic or not detectable in ESCs, but some are rhythmic in dESCs.
qPCR data comparing relative clock gene mRNA expression in ESCs (n = 6, white circles) and dESCs (n = 6, black circles). Comparisons of A) mClock, B) mBmal1 and, C) mRor-a. Line segments connecting data points denote statistically rhythmic oscillations. Error bars indicate ± SEM.

