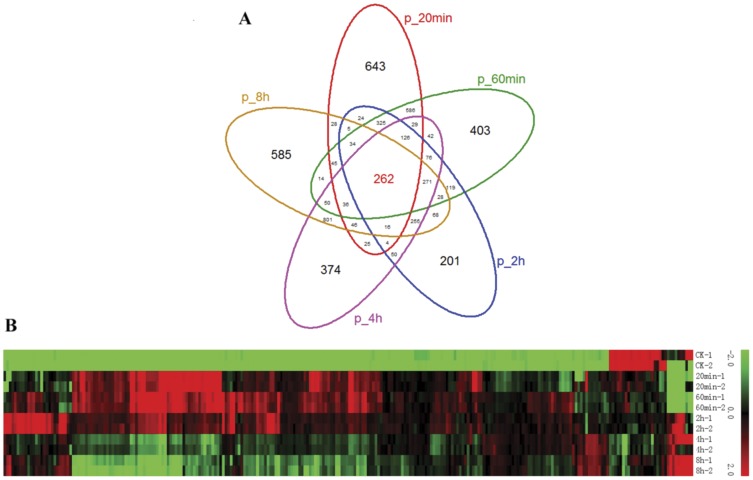
Figure 2. Significantly-regulated probes on the time course of heat stress.
A, Venn diagram analysis on the differentially expressed probes at all time points identified 262 significantly regulated probes on the time course of heat stress. B, Expression pattern of the 262 significantly regulated probes using Hierachical Clustering (HCL) algorithm. The color scale (representing the average of normalized values) is shown at the right, and green bar indicates low expression, and red for high expression.

