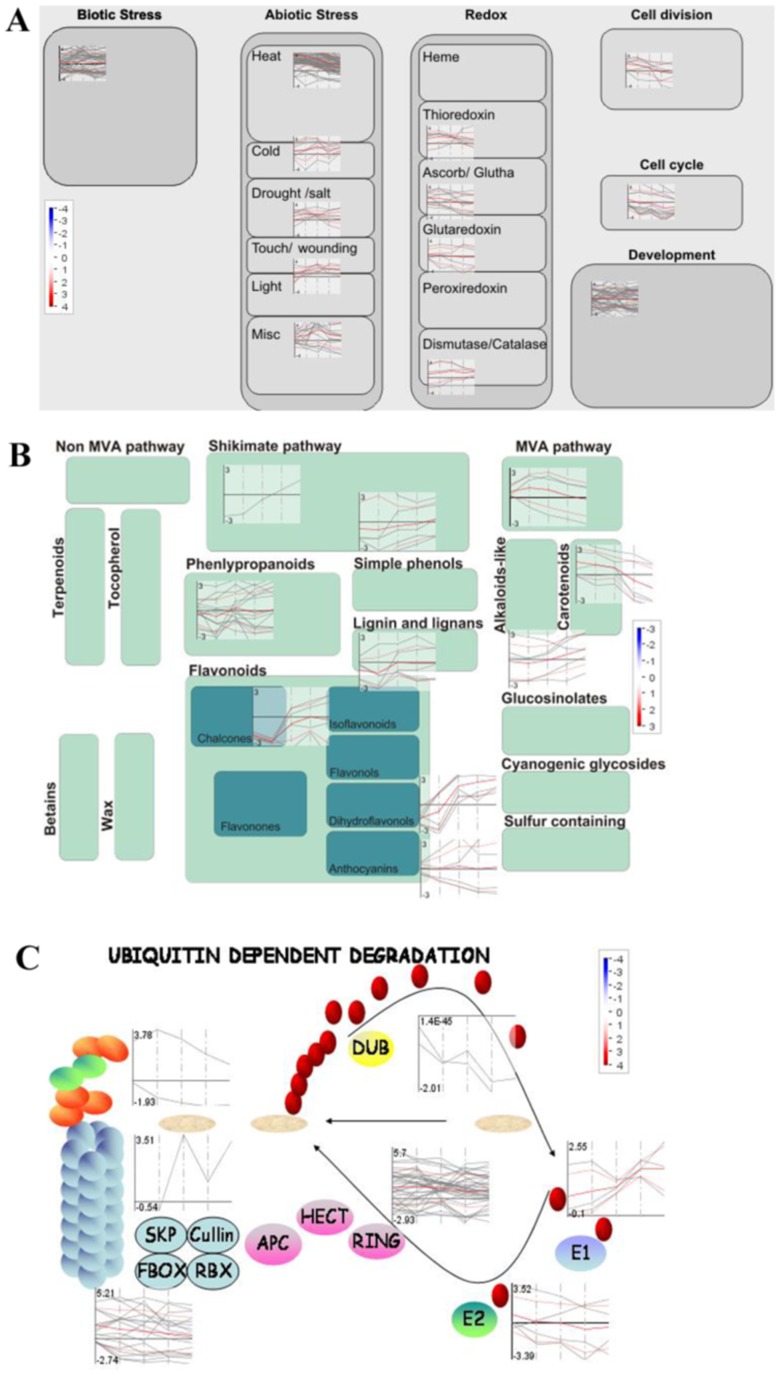
Figure 4. Expression profiles of the genes in cellular response, secondary metabolism and the ubiquitin-proteasome system.
MapMan was used to visualize the HR genes in the cellular response (A), secondary metabolism (B) and ubiquitin-proteasome system (C). Each BIN or subBIN is represented as a block with each transcript colored red for up-regulation or blue for down-regulation.

