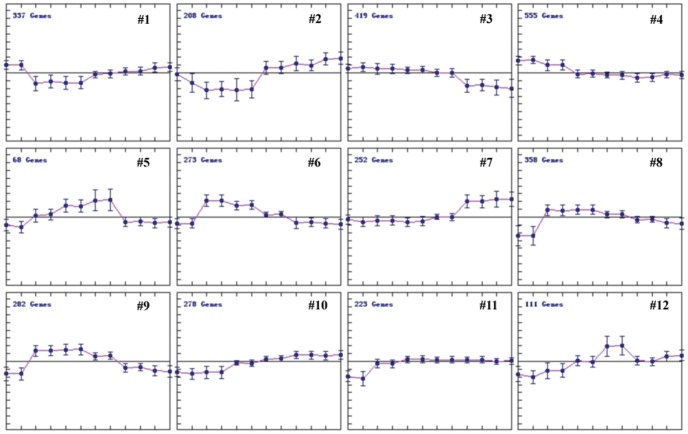
Figure 5. Expression patterns of the HR genes.
The HR genes were divided into 12 clusters (from #1 to #12) based on their expression level using k-Means clustering (KMC) algorithm, and #1 belongs to early down-regulated, #2 for early down and late up-regulated, #3 for late down-regulation, #4 for continuous down-regulation, #5, #6, #8 and #9 for early up-regulation, #7, #10 and #11 for late up-regulation, #12 for continuous up-regulation. The vertical axis represented for the gene expression signal value, and the horizontal axis represented for the 12 samples in order (from left to right: CK-1, 2; 20 min-1, 2; 60 min-1, 2; 2 h-1, 2; 4 h-1, 2; 8 h-1, 2 ).

