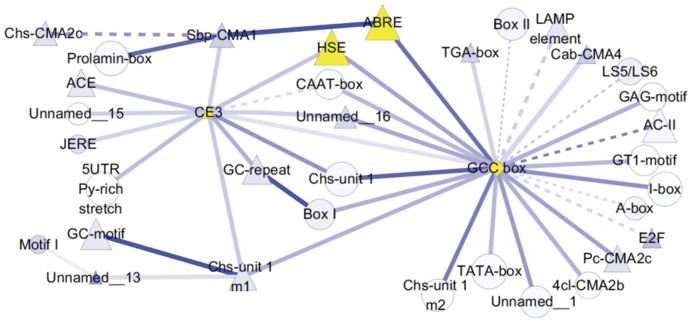
Figure 7. Co-occurrence analysis on the promoters of the HR genes from Cluster 9 of KMC.
The motifs were scanned using FIMO in the −3000 bp upstream ATG of all genes in cluster 9. The motif enrichment and significance of motifs co-occurrence were assessed by the hypergeometric distribution, and the data were imported into Cytoscape. The important stress-responsive motifs such as GCC box, CE3, ABRE and HSE were significantly enriched (marked by yellow). Diamond represents the nodes most significantly enriched (p<0.001), triangle for significantly enriched (0.001<p<0.05), and circle for not significantly (0.05<p). Solid lines are referred as the p-value of co-occurrence less than 0.01, and dash lines as p-value between 0.01 and 0.05.

