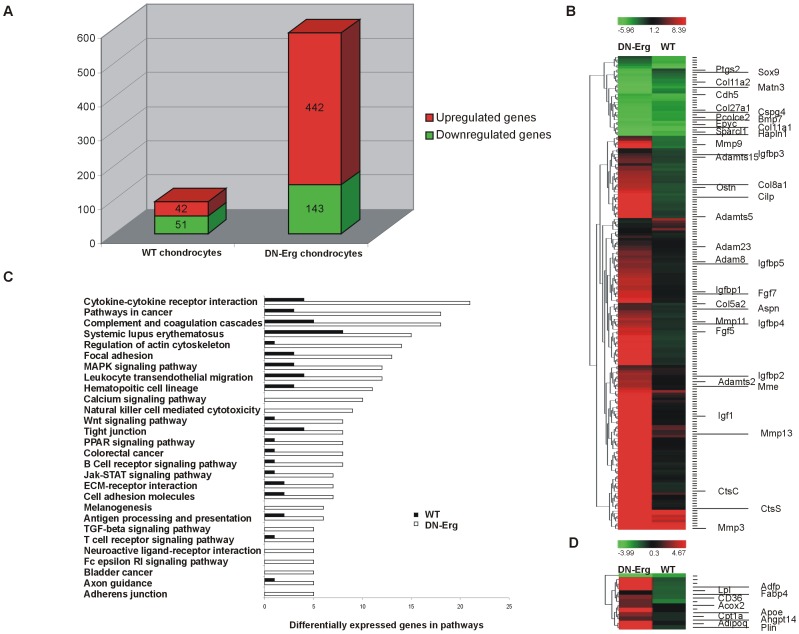
Figure 3. Microarray analysis and gene ontology analysis of signalling pathways.
A. Numbers of genes with differential expression between monolayer culture day 0 and day 20 in wt and DN-Erg embryo (E18.5) chondrocytes. Probe sets were filtered according to a 10-fold change cut-off. B. Hierarchical Clustering (HCl) diagram with clusters genes corresponding to the “extracellular matrix”, “metallopeptidase activity”, “Cartilage condensation and development”, “Ossification” annotations. C. Major signalling pathways predicted using Pathway-Express. Pathways listed are pathways with at least 5 or more genes which expression was modified during culture, as determined by Pathway Express. D. Hierarchical Clustering (HCl) tree with clusters of “Lipid metabolism process” and “Lipid transport” genes.

