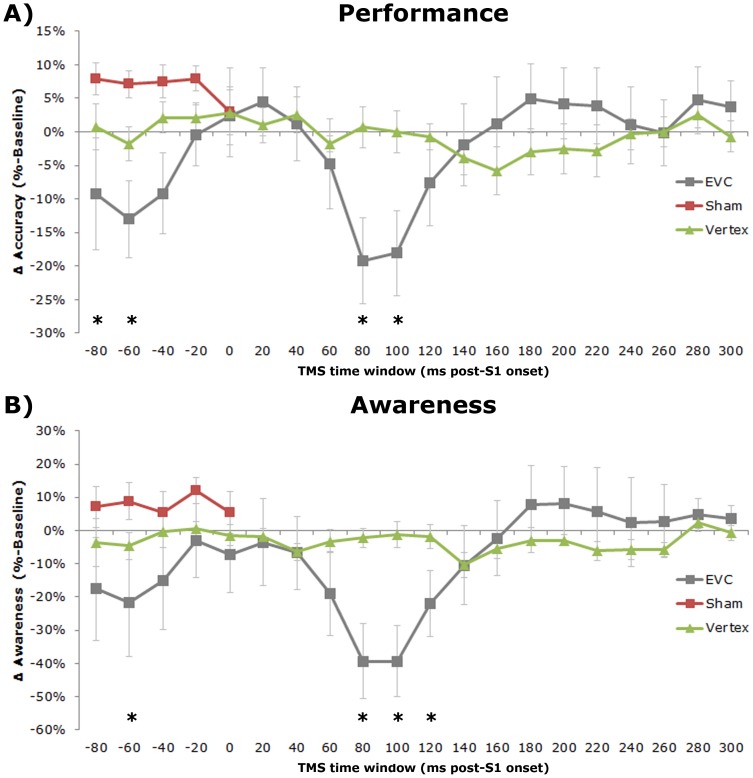
Figure 2. Recognition task data.
A) Accuracy relative to baseline (No TMS) for the experimental EVC TMS (grey line), control Sham TMS (red line), and Vertex TMS (green line) datasets, expressed as the percentage of correct responses. Error bars indicate standard errors of the mean. Asterisks indicate EVC TMS time windows in which the accuracies are significantly different from baseline. B) Awareness ratings relative to baseline (No TMS) for the experimental EVC TMS (grey line), control Sham TMS (red line), and Vertex TMS (green line) datasets, expressed as the difference in percentage ‘seen’ stimuli. Error bars indicate standard errors of the mean. Asterisks indicate EVC TMS time windows in which the awareness ratings are significantly different from baseline. This figure represents data already published in [18], and is presented here again in a modified version to allow for a direct comparison with the behavioral priming effects.

