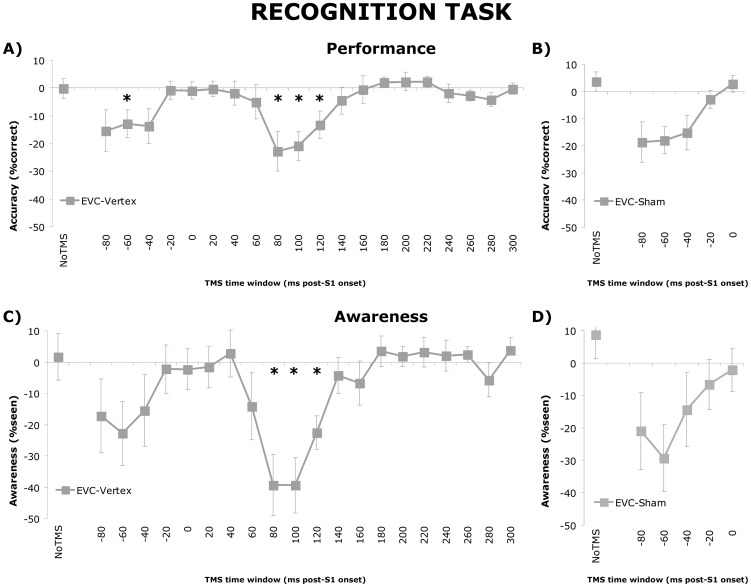
Figure 3. Recognition task data.
A) Difference scores between accuracies, defined as the percentage correct responses, in the EVC TMS group versus the average accuracy in the Vertex TMS group per TMS time window. Error bars represent standard errors of the mean (SEM). B) Difference scores between accuracies, defined as the percentage correct responses, in the EVC TMS sessions versus the average accuracy in the Sham TMS session per TMS time window. Error bars represent SEM. C) Difference scores between awareness, defined as the percentage of trials indicated as seen, in the EVC TMS group versus the average awareness in the Vertex TMS group per TMS time window. Error bars represent SEM. D) Difference scores between awareness, defined as the percentage of trials indicated as seen, in the EVC TMS sessions versus the average awareness in the Sham TMS session per TMS time window. Error bars represent SEM. This figure represents data already published in [18], and is presented here again in a modified version to allow for a direct comparison with the behavioral priming effects.

