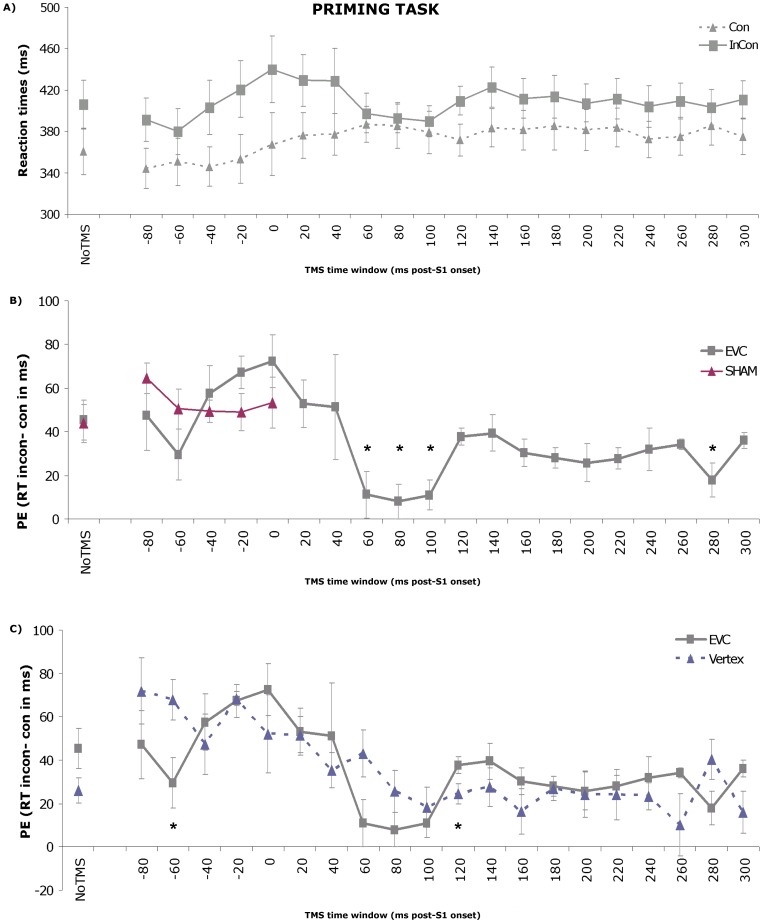
Figure 4. Behavioral priming data.
A) Reaction times (RT) to congruent (solid line) and incongruent (dashed line) S2 stimuli per TMS time window. Only experimental (i.e. EVC) data are depicted here. Error bars represent standard errors of the mean (SEM). B) The average priming effect (PE), defined as the reaction times (RTs) in milliseconds on incongruent trials minus the RTs on congruent trials, across TMS time windows is plotted for both the EVC TMS data (grey line) and the Sham TMS data (purple line). Error bars represent SEMs. Significant differences relative to No TMS are indicated with an asterisk. C) The average priming effect (PE), defined as the reaction times (RTs) in milliseconds on incongruent trials minus the RTs on congruent trials, across TMS time windows for both the EVC and Vertex TMS data. Significant differences between the two groups are indicated with an asterisk.

