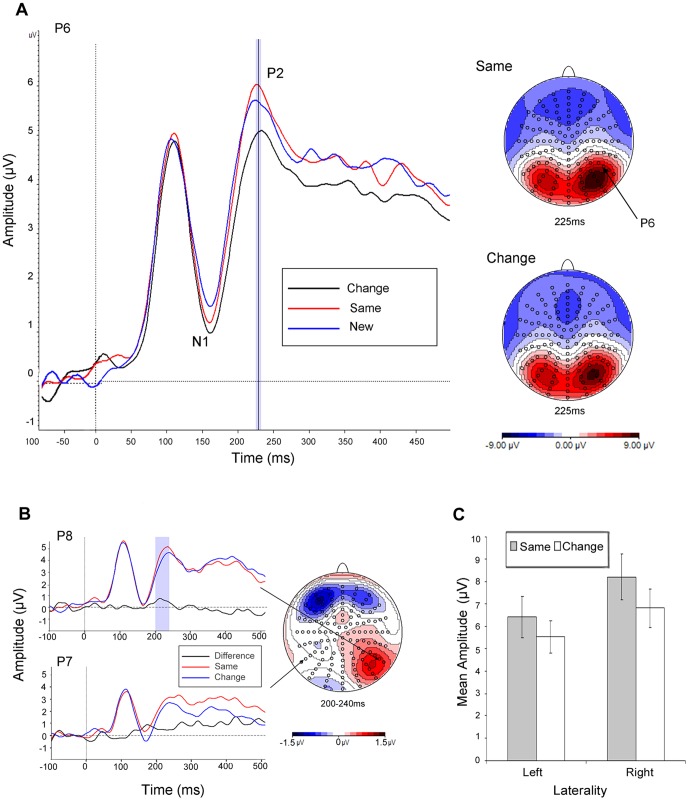
Figure 2. ERP Shape+colour repetition effects.
(a) Grand average ERPs to same (red line) versus change (black line) stimuli plotted between −100 and 500 msec, with respective topographies for the P2 at peak amplitude; (b) topography associated with the difference in mean amplitude for the same versus change contrast over the highlighted 40 msec epoch for the P2; (c) mean amplitudes across posterior electrode clusters during the P2 as a function of laterality and transformation.

