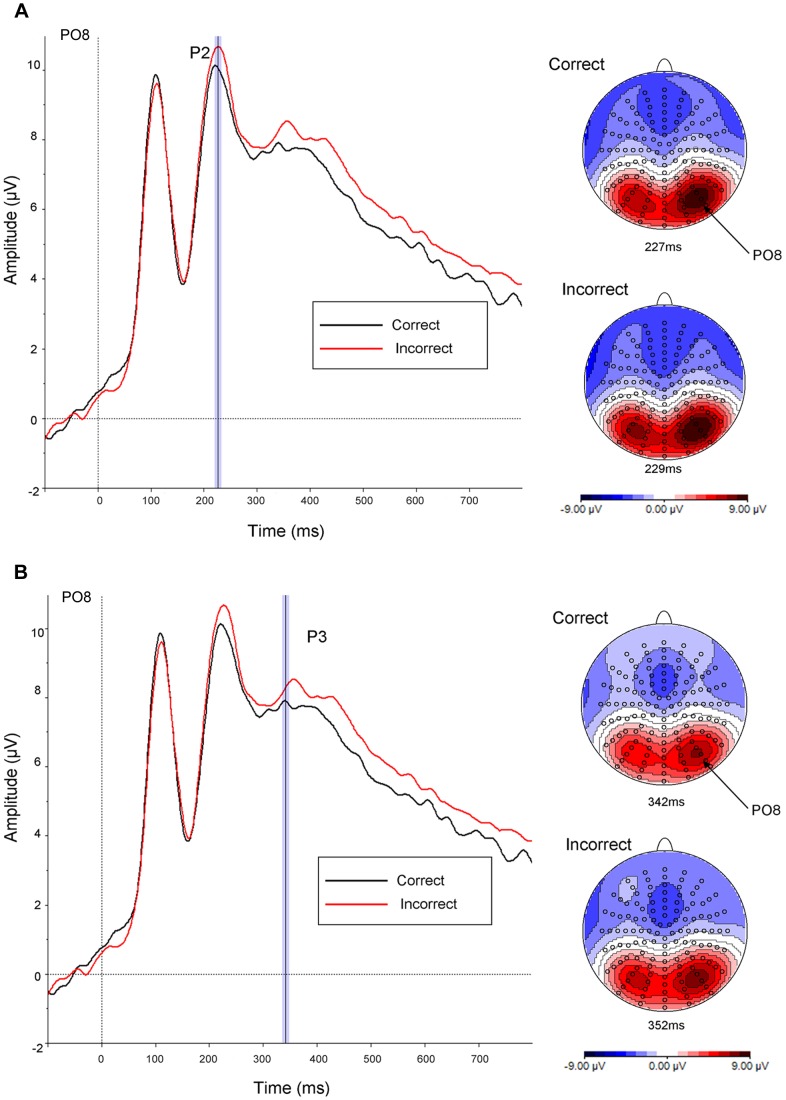
Figure 3. ERP Colour effects.
Grand average ERPs to correctly (black line) and incorrectly (red line) coloured objects plotted between −100 and 800 msec with (a) topography associated with the peak amplitude for correctly versus incorrectly coloured objects for the P2; and (b) topography associated with the peak amplitude for correctly versus incorrectly coloured objects for the P3.

