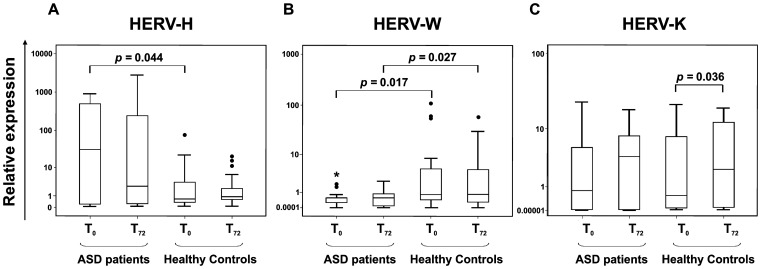
Figure 1. Relative HERV-H, W and K expression in ASD patients and healthy controls.
Data obtained in fresh PBMCs (T0) and after in vitro stimulation (T72) of ASD patients and healthy controls are represented as box plot. ASD patients show higher levels of HERV-H (panel A) both at T0 and after in vitro stimulation in comparison to healthy controls. Conversely, HERV-W (panel B) expression is higher in healthy controls than in ASD patients, both at T0 and after in vitro stimulation. Significant differences between groups are shown. HERV-K (panel C) expression levels were similar in ASDs compared to HCs in both conditions, and significant differences were achieved only inside control group. Relative env gene expression levels were analyzed by Real-time PCR and represented by 2−ΔΔCt in logarithmic scale.

