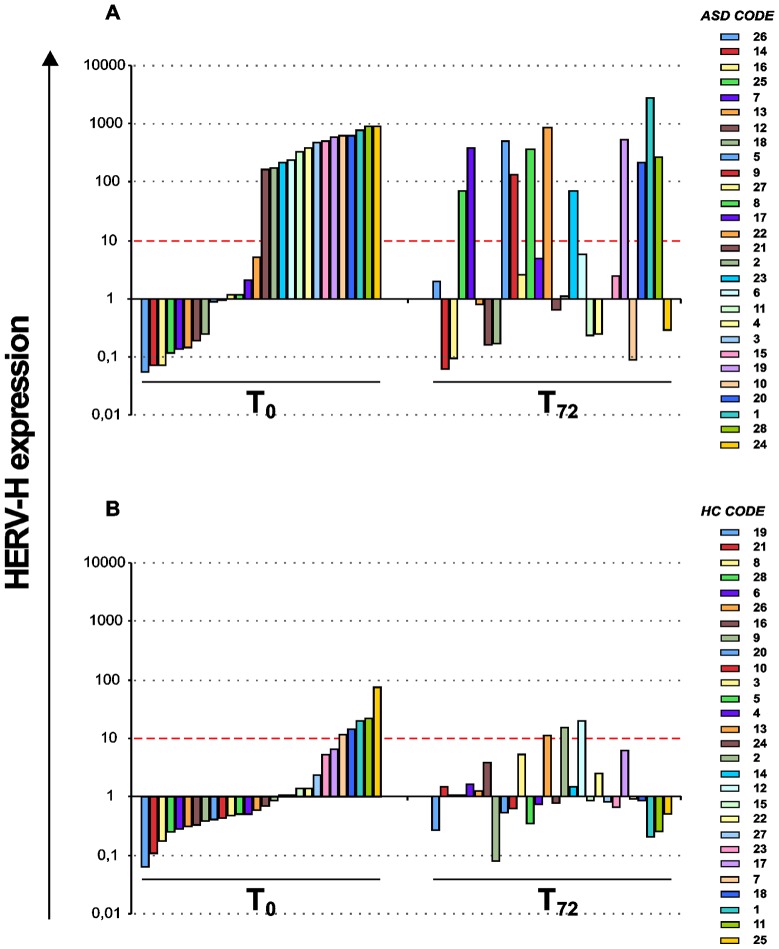
Figure 2. Quantitative evaluation of HERV-H expression in individual ASD patients and healthy controls.
Comparative analysis of expression levels in individual ASD patients (panel A) shows that in vitro stimulation of PBMCs induces HERV-H expression increase in the patients with low levels at T0. Conversely, in vitro stimulation does not modify HERV-H levels in individual HC (panel B). Results obtained by Real time PCR are represented as 2−ΔΔCT in logarithmic scale. Red dashed line identifies values 2−ΔΔCT>10.

