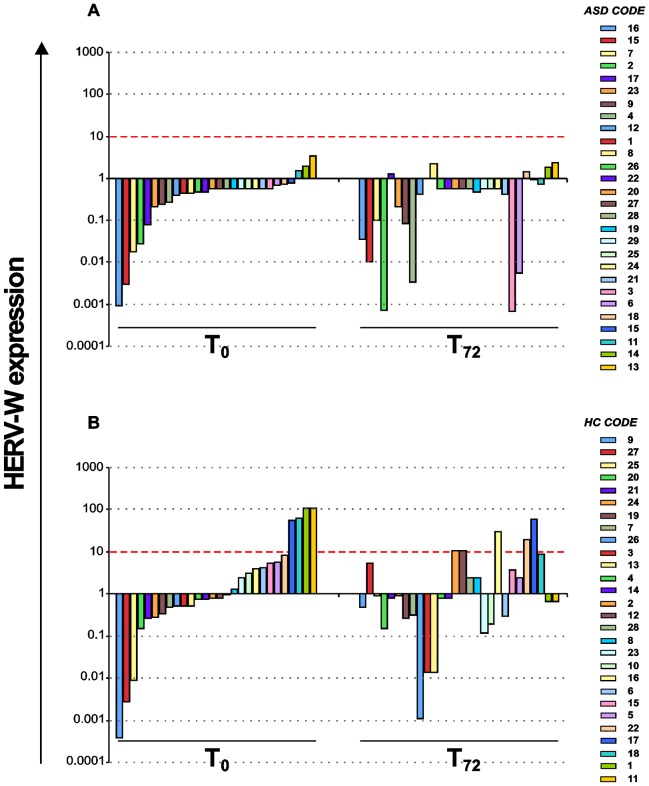
Figure 3. Quantitative evaluation of HERV-W expression in individual ASD patients and healthy controls.
No significant differences in expression levels of individual ASD patients (panel A) and healthy control (panel B) after in vitro stimulation are observed. Results obtained by Real time PCR are represented as 2−ΔΔCT>10 in logarithmic scale. Red dashed line identifies values 2−ΔΔCT>10.

