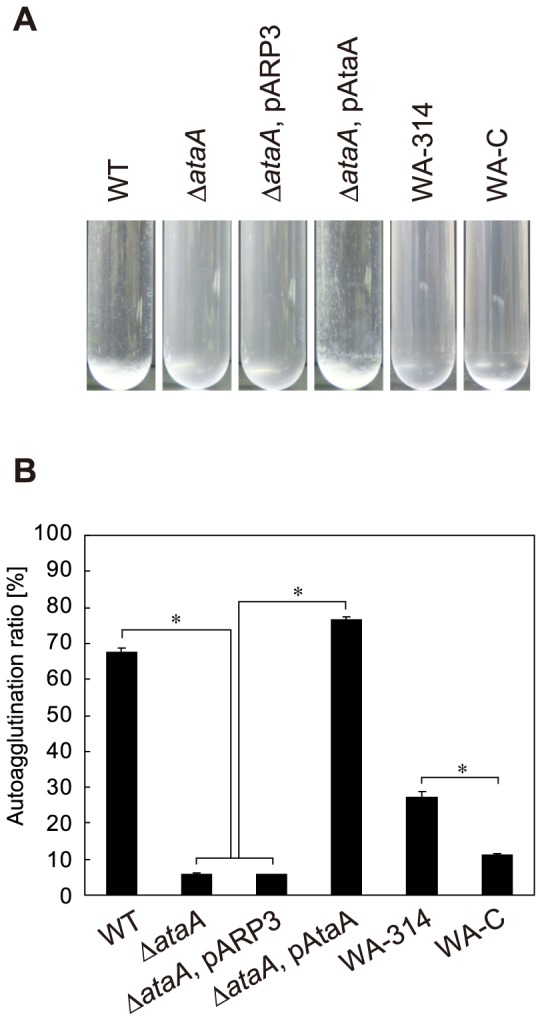
Figure 6. Autoagglutination assay of Acinetobacter sp. Tol 5, its derivatives, and Y. enterocolitica strains.

(A) Strains expressing ataA (WT; ΔataA, pAtaA) autoagglutinate and form cell clumps that settle at the bottom of test tubes. After standing for 3 h without agitation, suspensions of these strains were transparent due to the sedimentation of cells, whereas cell suspensions of strains lacking functional ataA (ΔataA; ΔataA, pARP3) remained cloudy. Yersinia strain expressing YadA (WA-314) partially formed cell clumps. Cell suspension of WA-314 strain was slightly transparent compared with the yadA-mutant strain (WA-C). (B) Autoagglutination observed in (A) was quantified by a decrease in optical density at 660 nm (OD660). Graph bars show the autoagglutination ratio (%). Data are expressed as mean and SEM (n = 3) values. Statistical significance, *P<0.001.
