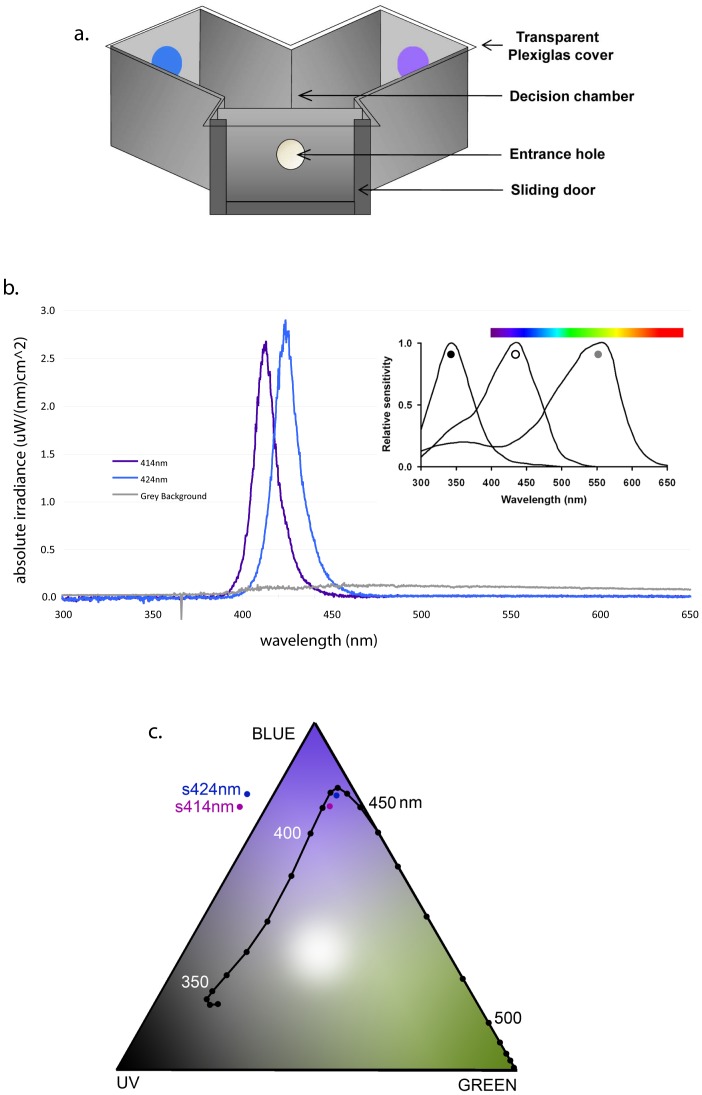
Figure 1. Testing of honeybee colour vision.
(a) Schematic diagram of Y-maze apparatus used to test free flying bees. LED array position was varied between experimental trials (see Methods). (b) Example of an absolute irradiance spectra measurement for LED stimulus arrays. Inset shows spectral sensitivity for long- (grey circle), medium- (open circle), and short- (black circle) wavelength sensitive photoreceptors in honeybees. Colour bar indicates approximate perceived colour range in humans. Adapted from Dyer et al., 2011 using the data for honeybees from Peitsch et al. 1992. (c) Plots of LED stimuli in a Maxwell triangle colour model representing the trichromatic (ultraviolet, UV; blue, B; green, G) colour vision of honeybees. Spectral loci show theoretical stimulation by spectrally pure radiation.

