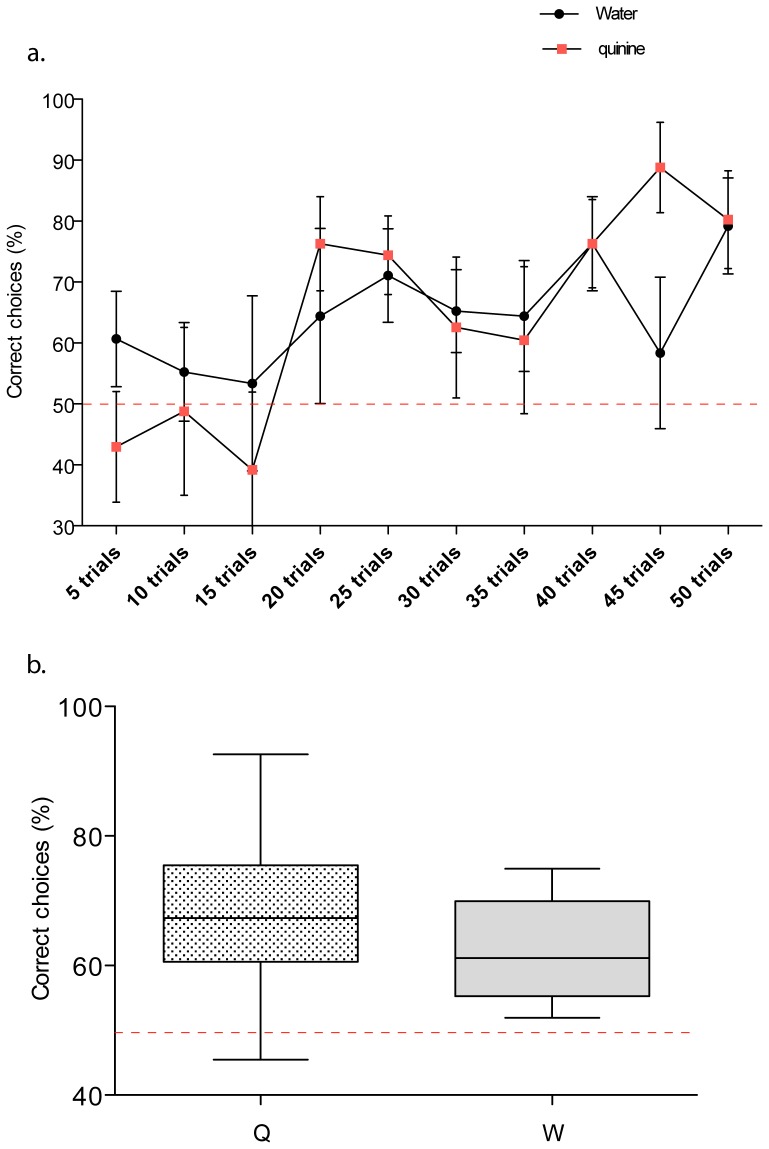
Figure 2. Colour learning in honeybees with differential conditioning.
(a) Acquisition curves for LED colour discrimination over 50 trials. Mean ± SEM of correct choice frequency for each 5-trial block. (b). Unrewarded touch test performance following 50 trial training interval for neutral (W: water) and aversive (Q: quinine) distractor stimuli. Mean ± SD correct touch frequency. Note that the Y-axis in each panel is abbreviated to enhance visibility. Red dotted lines indicate expected chance performance level (50%) bee choices following differential conditioning were significantly different from chance (see text for stats). In the touch tests the mean number of choices made by bees was 29.4±1.4 SEM.

