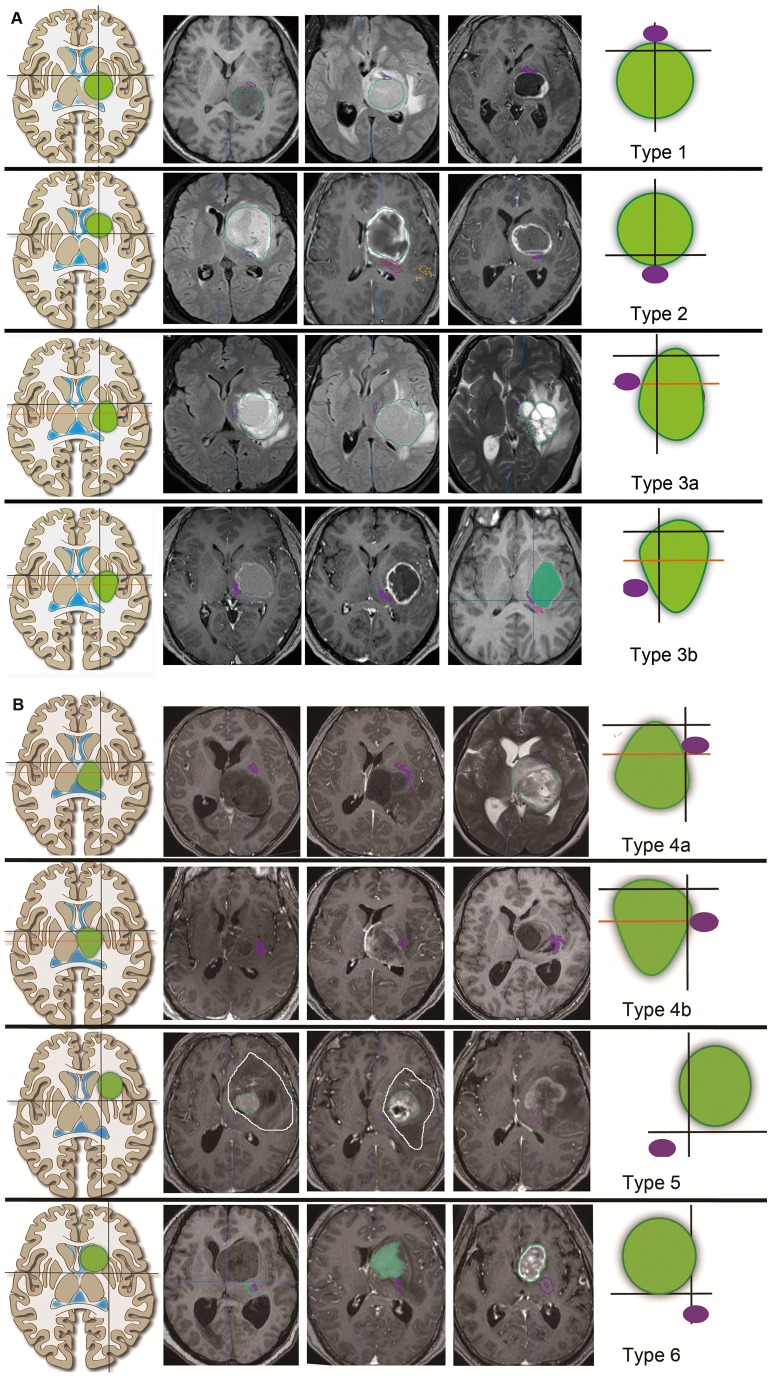
Figure 3. Three typical tumors and corresponding PT positions are shown for each type of tumor.
A. Type 1 to type 3b tumors. B. Type 4a to type 6 tumors. The left column lists the tumor types. The right column demonstrates the relative positions of the PTs relative to each type of tumor. The green circles indicate tumors. The purple circles indicate the PT location. The middle three columns are typical cases. The PT positions are depicted by the purple line. Certain tumor boundaries are depicted by the green lines or green color, which indicate the enhanced part of the tumor. In the first and second case of type 5 tumor, the white lines show the entire brain with abnormal signals, which were much larger than the enhanced portions. These two tumor types were judged according to the shapes of the white lines, which were mainly above line 2.

