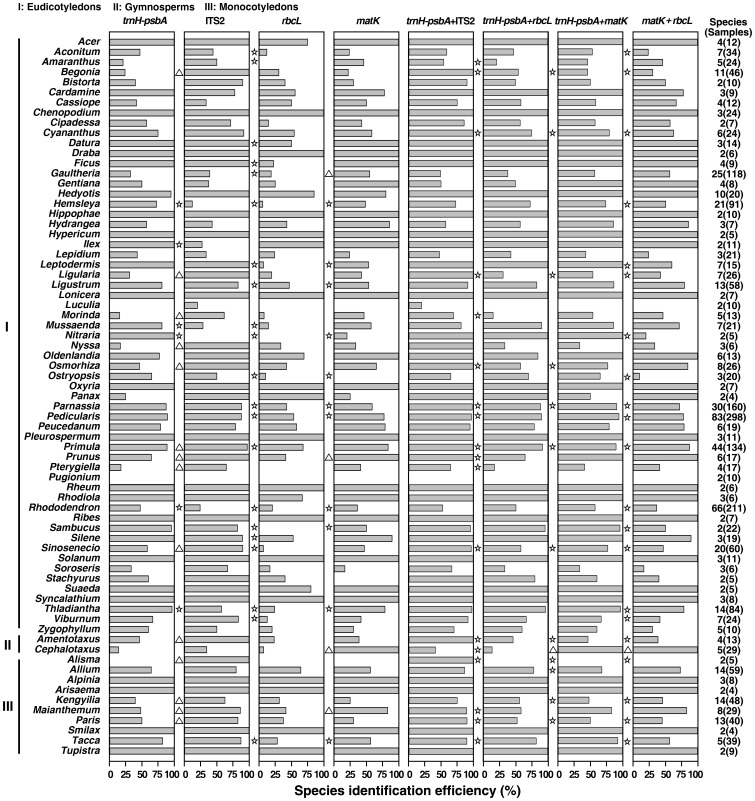
Figure 5. Comparison of the identification success rates for markers in different genera and the corresponding statistical test results.
The statistical tests were carried out between trnH–psbA and the other three single markers, or trnH–psbA+ITS2 and three other marker combinations, respectively. The significant differences are indicated to the left of the column for the corresponding marker or marker combination. “☆” indicates that the identification success rates for trnH–psbA or trnH–psbA+ITS2 are significantly higher than those of the corresponding marker or marker combination. “▵” indicates that the identification success rates for trnH–psbA or trnH–psbA+ITS2 are significantly lower than those of the corresponding marker or marker combination.

