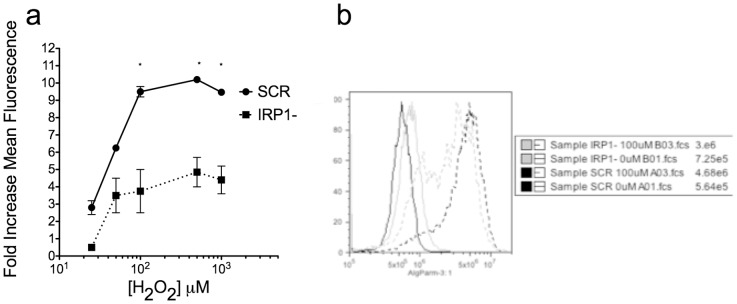
Figure 2. Hydrogen peroxide-induced ROS formation is decreased in IRP1- cells.
Panel a: cells were loaded with 100 nM H2-DCFDA and then assayed for increases in fluorescence by flow cytometry following indicated doses of hydrogen peroxide, plotted as fold increase over control. Data are mean +/− SEM of three independent experiments. Two-way ANOVA was used to test significance at each dose (* = p<0.05). Panel b: Representative histograms treated with 0 and 100 µM hydrogen peroxide.

