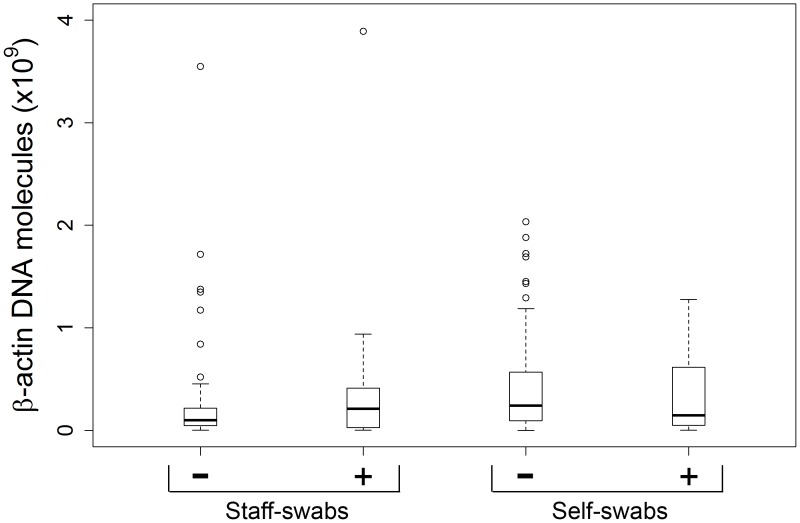
Figure 4. Relation between β-actin DNA concentration and viral positivity status in staff- and self-collected swabs collected on the same day.
Analysis based on the data set used for Figure 2, but stratified according to viral detection status (+ positive, − negative). Y-axis: human β-actin DNA molecules per swab. P values: p = 0.186 for comparison between negative and positive staff-swabs; p = 0.404 for comparison between negative and positive self-swabs (Wilcoxon rank sum test).

