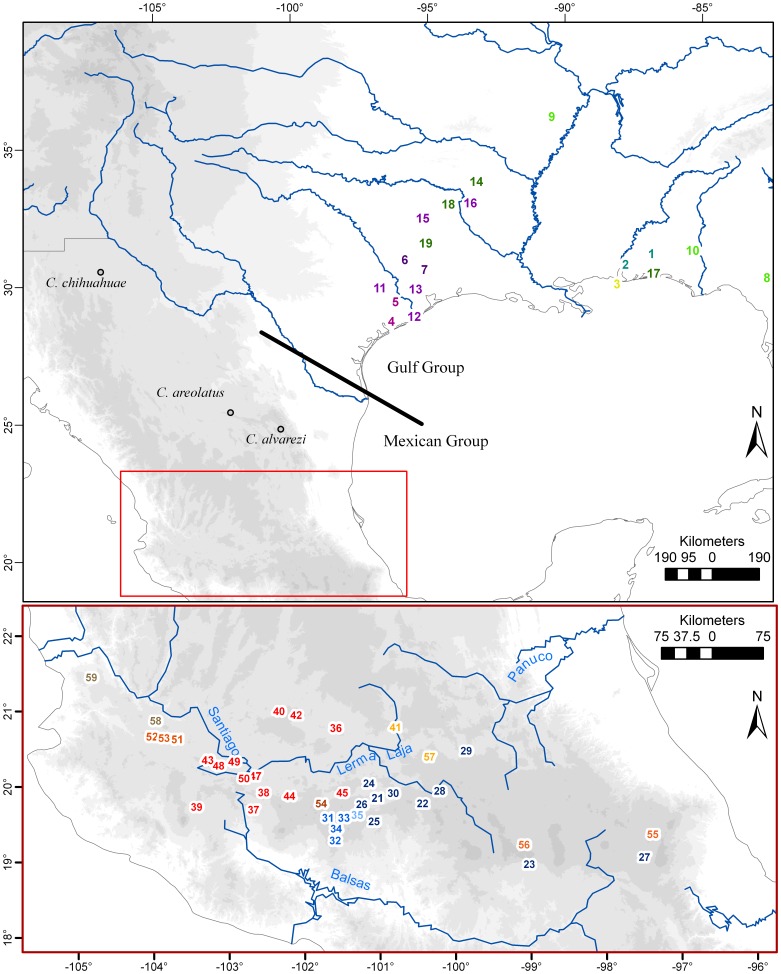
Figure 1. Map of localities sampled.
Map of localities sampled in this study, numbers are referred to in Table 1. Sample locations are colored to represent different clades recovered by phylogenetic analyses (see Fig. 3). Open circles correspond to the only locality records for the three species not included in the analyses as they were not found during sampling, or did not amplify during PCR reactions. Gray background refers to elevation (500–6000 m).

