Figure 1.

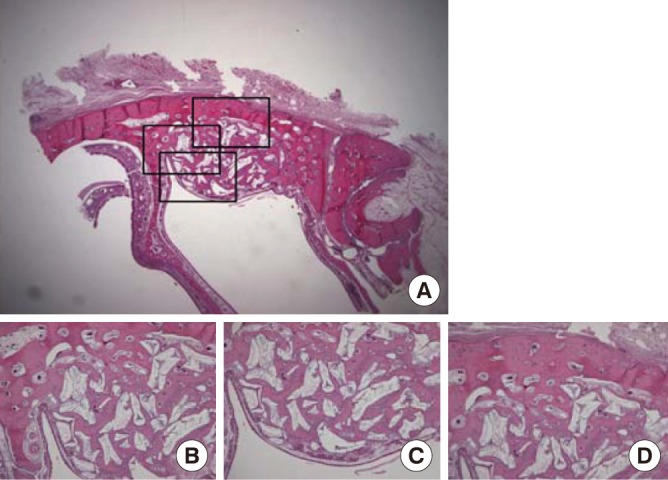
Histological findings of control group (biphasic calcium phosphate) at 4 weeks. (A) Area of interest (H&E, ×12.5), (B) defect margin area (H&E, ×50), (C) the Schneiderian membrane (H&E, ×50), and (D) middle area (H&E, ×50).

Histological findings of control group (biphasic calcium phosphate) at 4 weeks. (A) Area of interest (H&E, ×12.5), (B) defect margin area (H&E, ×50), (C) the Schneiderian membrane (H&E, ×50), and (D) middle area (H&E, ×50).