
Figure 6. Effects of TGFα on KGN cell morphology and migration.
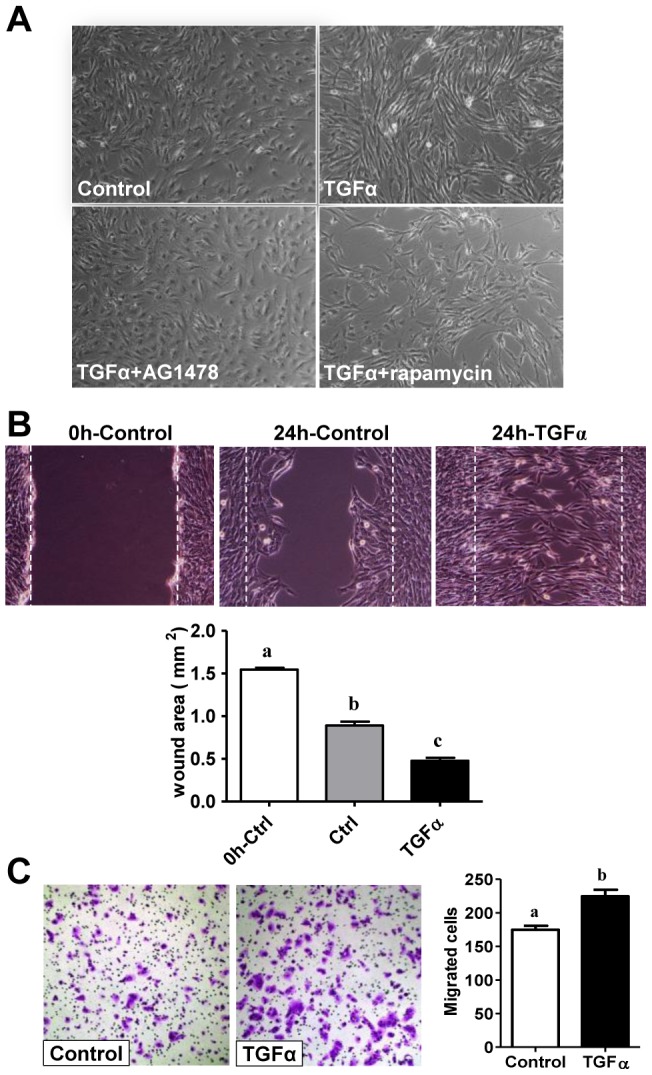
A) Effect of TGFα on KGN cell morphology. TGFα treated cells become elongated and morphologically more fibroblast-like. Magnification, 200×. B) The would healing assay was performed to determine the effect of TGFα on KGN cell migration. The initial wound is highlighted by the white dashed line. The wound area was quantified with Microsuit™ FIVE software (Olympus American inc. Center Valley, PA). Bars represent mean areas ± SEM. Bars with different letters are significantly different (P<0.05) from each other. Magnification, 200×. C) Effects of TGFα on KGN cell migration analyzed with a Transwell migration assay system. Migrated cells were counted manually. Data are presented as means ± SEM. Bars with different letters are significantly (P<0.05) different from each other. Magnification, 100×.