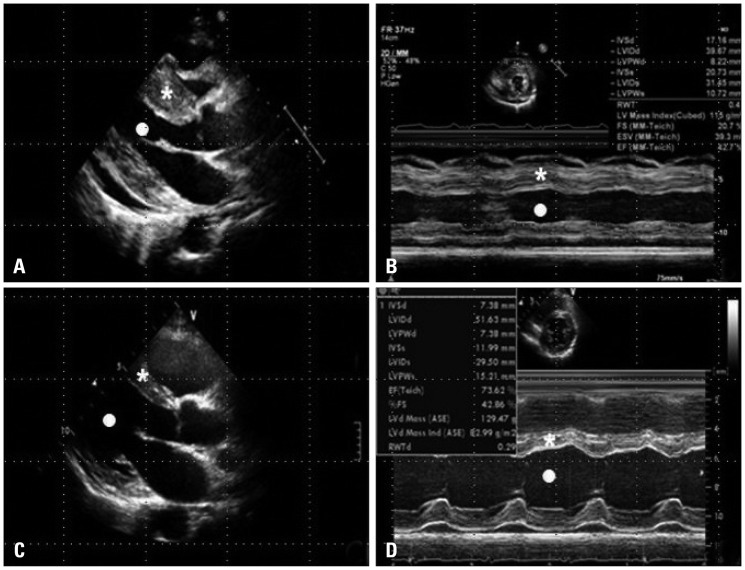
Fig. 2.
Transthoracic echocardiogram (TTE). A: Parasternal long axis view of TTE showed edematous myocardium with increased echogenicity and small pericardial effusion. B: M-mode image of mid ventricular level of left ventricle showed decreased contractility. C: Follow-up TTE after treatment showed markedly decreased echogenicity of myocardium and pericardial effusion. D: M-mode image also showed normalized left ventricular (LV) wall thickness and recovered LV contractility after steroid therapy. *: interventricular septum, •: left ventricular cavity.

