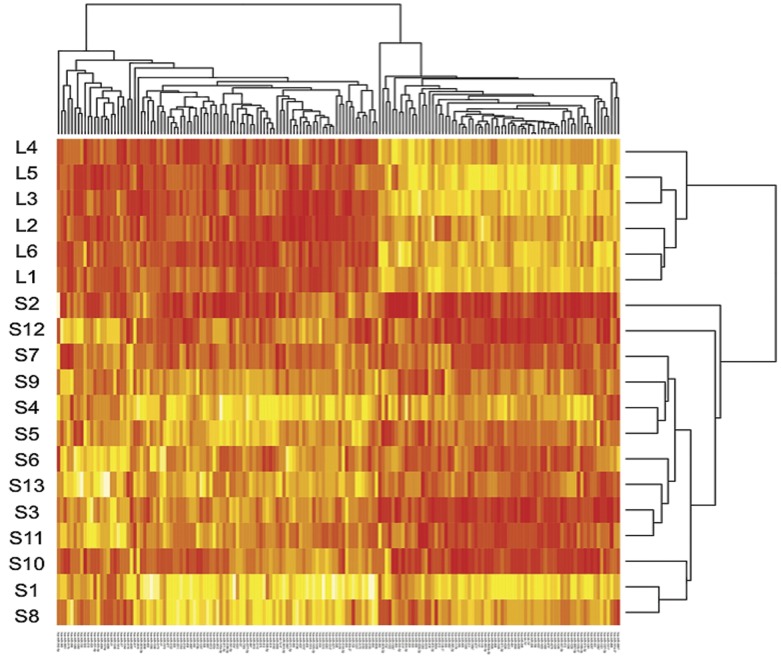
Figure 1. Heatmap of the clustering of 170 miRs filtered based on t-test p-value<0.05.
In order to perform hierarchical cluster analysis we constructed a distance matrix using the two-tailed Spearman correlation test, due to the non-normal distribution of expression within samples. The cluster analysis shows a good separation between the two groups of samples, based on the significantly different miRNAs. The microRNA expression data were centered by 2 directions (i.e., by miRNA and patients). Red and yellow represent low and high miRNA expression, respectively.

