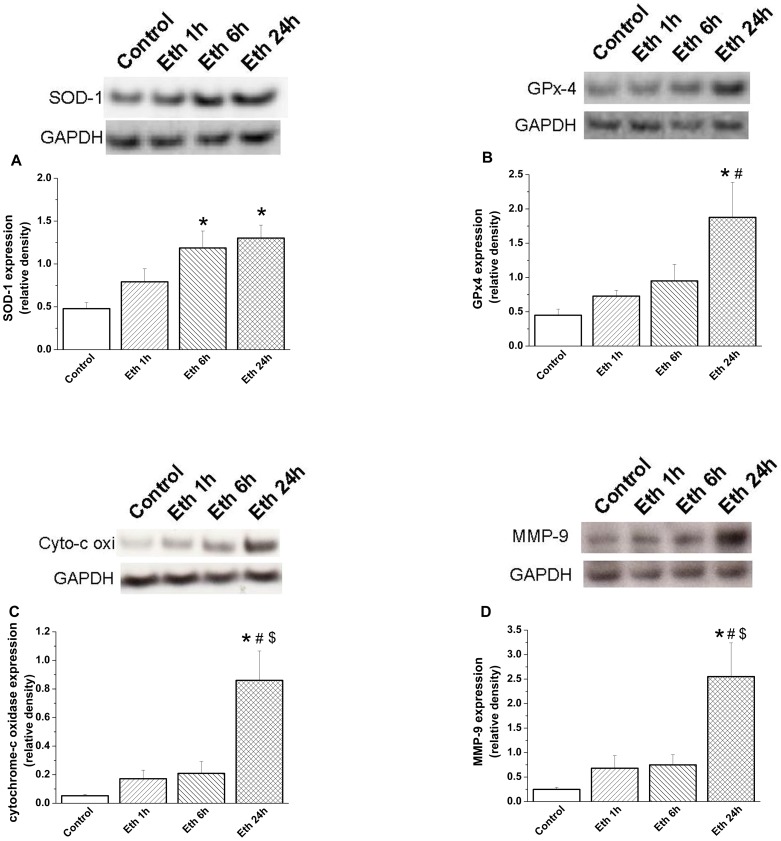
Figure 6. Effect of acute ethanol exposure on myocardial protein expression.
Densitometric analysis of bands for (A) superoxide dismutase (SOD)-1 showed a significant increase after 6 h and 24 h ethanol administration, and (B) glutathione peroxidase (GPx)-4, (C) cytochrome-c oxidase (cyto-c oxi) and (D) MMP-9 following 24 h, compared with the control group. Glyceraldehyde-3-phosphate dehydrogenase (GAPDH). Eth indicates ethanol. *p<0.05 versus control; #p<0.05 versus ethanol 1 h, $p<0.05 versus ethanol 6 h.

