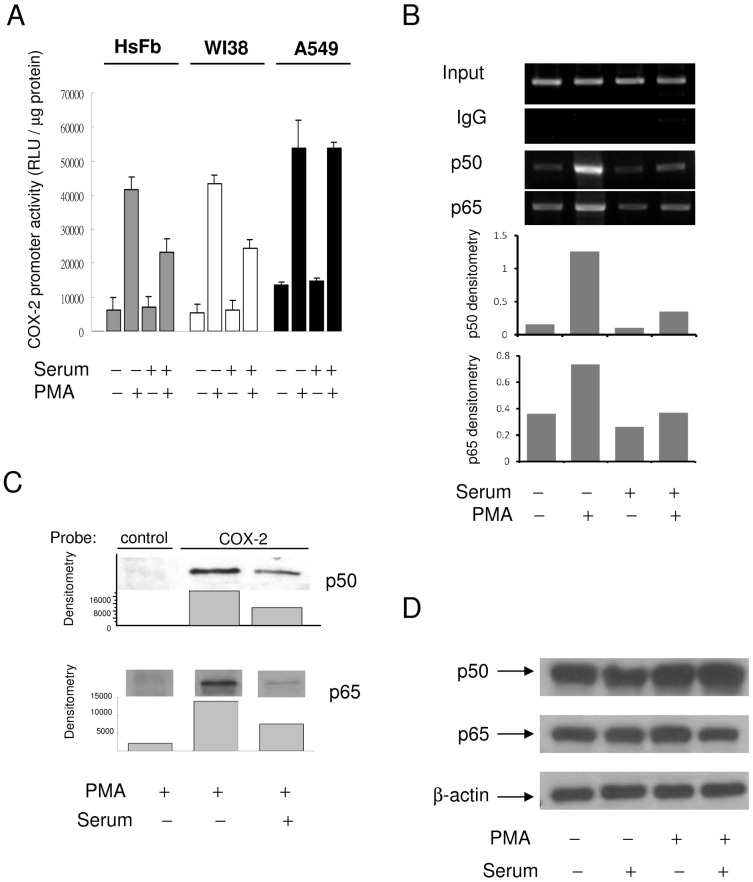
Figure 5. Differential COX-2 transcriptional activation in SF- vs. SR-cells.
(A) COX-2 promoter activity in SF vs. SR HsFb, WI38 and A549 cells. Each bar denotes mean ± SEM (n = 3). (B) and (C) NF-κB (p50/p65) binding to COX-2 promoter region analyzed by (B) ChIP and (C) streptavidin pulldown assay. (D) p50 and p65 NF-κB protein levels in SF- vs. SR-HsFb treated with and without PMA.

