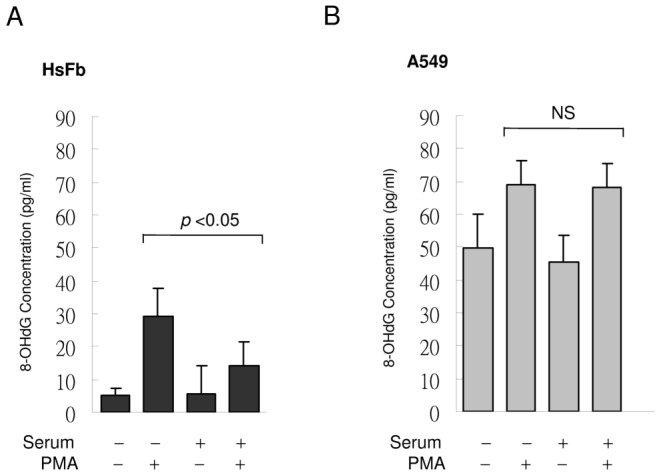
Figure 11. 8-OHdG levels in SF- vs. SR-HsFb and A549 cells.

(A) SF- or SR-HsFb were treated with PMA for 4 h and 8-OHdG was measured. (B) SF- and SR-A549 cells were treated similarly to (A). Each bar denotes mean ± SEM (n = 3). NS denote statistically non-significant.
