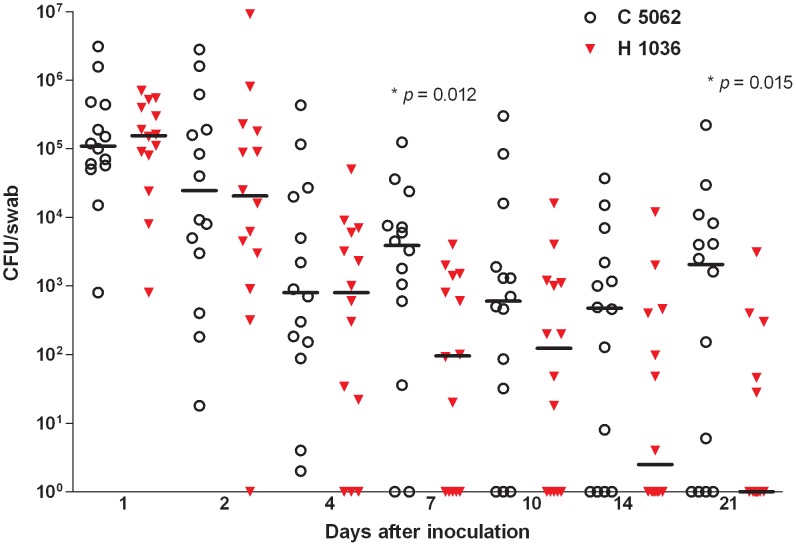
Figure 2. Bacterial loads in the nares of volunteers after inoculation.
Each dot represents the number of CFUs per swab at day 1, 2, 4, 7, 10, 14 and 21 after the inoculation with the mixture of S. aureus strain 1036 of human origin and strain 5062 of bovine origin. The horizontal bars represent the median number of CFUs at indicated sampling times.

