
Figure 3. Difference between the proportional changes in age-specific survival probability due to illegal poisoning, fecundity, and population growth rate.
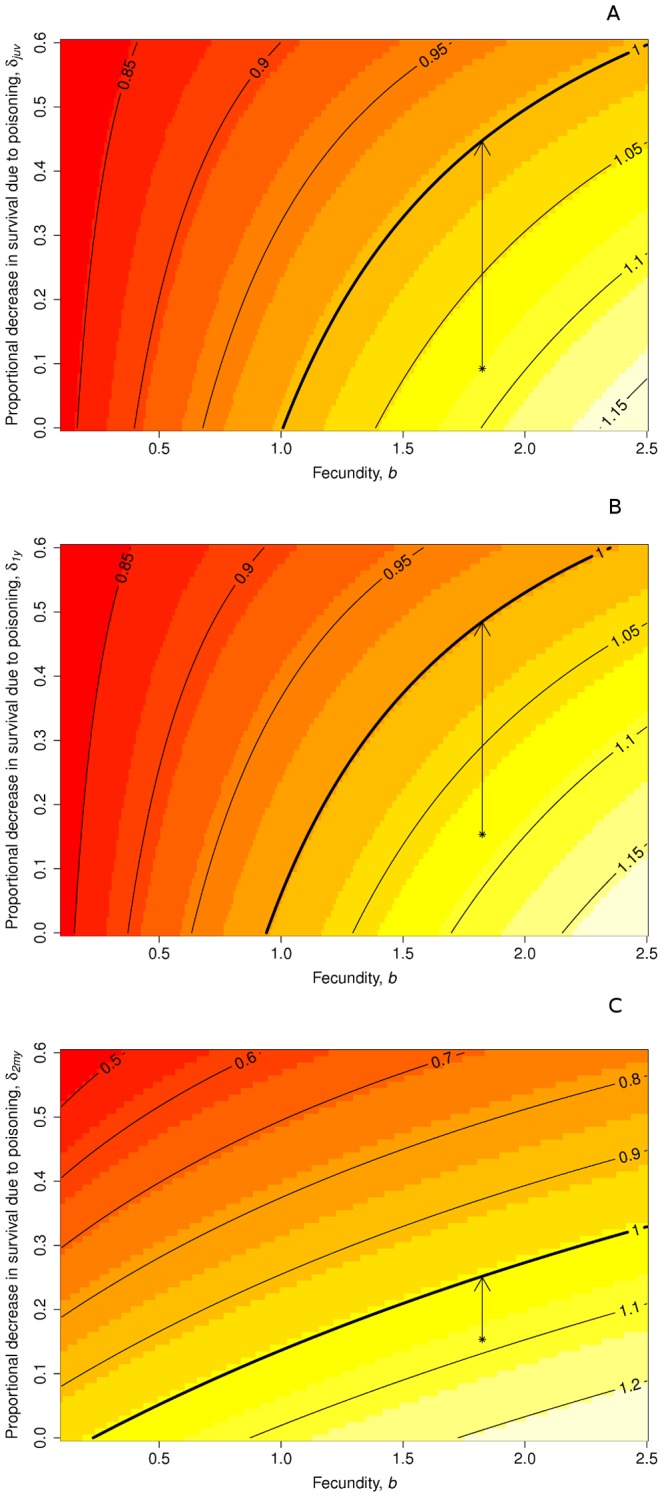
The bold line represents population stability. The asterisks refer to the current parameter estimates, while arrows represent a theoretical increase in  up to the level of population stability. a) juveniles. b) 1 year old. c) 2 or more year old red kites.