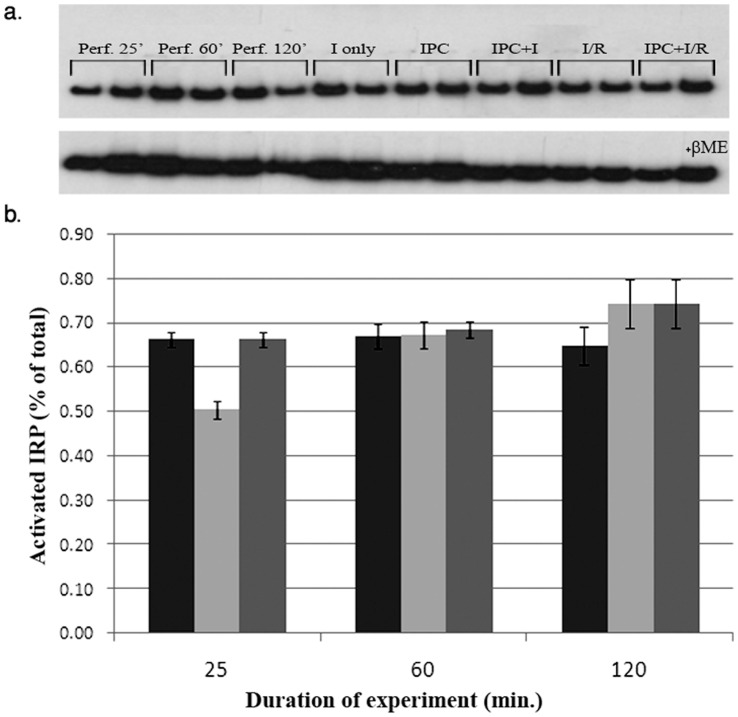
Figure 3. Representative EMSA using extracts of hearts subjected to I/R with and without prior IPC.
a. Original phosphorimaging blots. Upper panel shows active IRPs. Lower panel displays total IRPs (+βME). b. Graphic presentation of active IRP; three scanned blots each (±SE). Perfusion only- black, I/R- gray, IPC+ I/R- light gray. No efforts were made to distinguish between IRP1 and IRP2.

