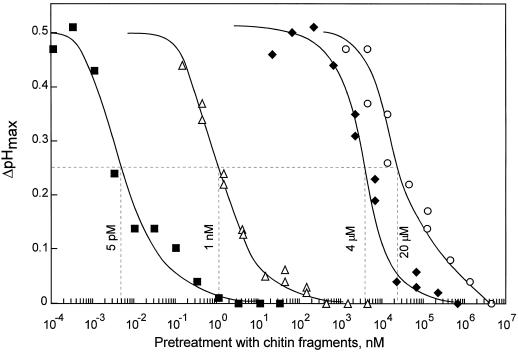
Figure 4.
Dose-response curves for induction of desensitization by different chitin oligomers. Alkalinization (ΔpHmax) in response to 10 nm CH4 was measured in cells pretreated with different amounts of chitin oligomers for 60 min. ▪, CH4; ▵, CH3; ♦, CH2; and ○, CH1. Hatched lines indicate concentrations of the prestimuli that reduce ΔpHmax in response to 10 nm CH4 by 50% (EC50 values for desensitization).

