
FIGURE 6.
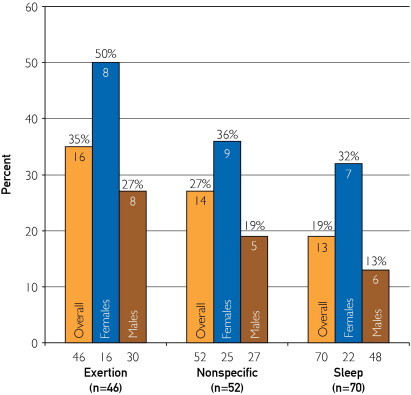
The different yield of mutation detection among the 3 main categories of sudden unexplained death–associated triggers or events (exertion, nonspecific, and sleep) for the overall cohort, females, and males at all ages. The numbers below the bars represent the number of cases in each category. The numbers within the bars represent the actual number of cases with a mutation, with the percent yield of mutation detection highlighted above the bars.