
FIGURE 9.
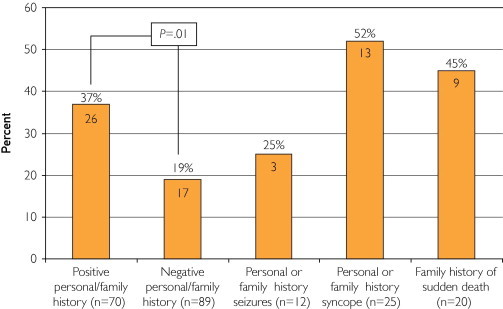
The difference in mutation detection yield between patients with sudden unexplained death (SUD) with either a negative (n=89) or positive (n=70) personal or family history of cardiac events or other “warning” signs, including seizures (n=12), syncope (n=25), or sudden cardiac death (n=20). The numbers in the bars represent the numbers of cases with a mutation, with the percent yield of mutation detection highlighted above the bars.