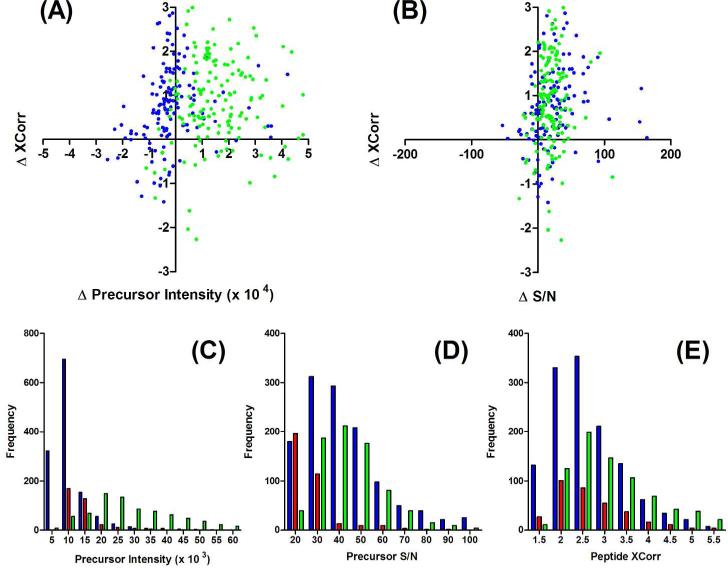
Figure 6.
Comparison of peptide precursor intensity, signal-to-noise ratio (S/N), and XCorr from duplicate analysis of 5 ng of Pfu tryptic digests using 5-step SPME-tITP-CE-MS/MS (blue), direct injection CE-MS/MS (green), and nLC-MS/MS (red). Correlation plots of changes (CE values – nLC values) in (A) precursor intensity and (B) S/N to changes in XCorr values of peptides identified in both CE and nLC experiments. Distributions of peptide (C) precursor intensities, (D) S/N ratios and (E) XCorr values were plotted for SPME-tITP-CE (blue), direct CE (green), and nLC (red) experiments. Noise was calculated by averaging the intensities of the lowest 10% peaks from the precursor MS scan. S/N ratios were calculated by dividing peptide precursor intensities by the noise within each scan. 209×165mm (300 × 300 DPI)

