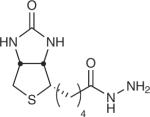
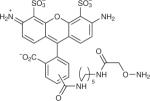
Table 1.
Examples of aldehyde-tag conjugation conditions.
| aldehyde reactive compound | chemical structure | protein | reagent concentration | conditions |
|---|---|---|---|---|
| Biotin hydrazide |

|
MBP6, GFP6, PDGFR-TM6 | 30–300 μM | 100 mM MES, pH 5.5, 37 °C, 2 h (in vitro) 50 μM, 10% FBS in PBS, pH 6.4, 1 h (cell culture) |
| AO-Flag |
|
MBP7, HGH7, IgG Fc6 | 300 μM | 100 mM MES, pH 5.5, 37 °C, 2 h |
| AO-Alexa Fluor 647 |

|
Stf07, MBP7, hGH7 | 300 μM | 100 mM MES, pH 5.5, 37 °C, 2 h |
| AO-PEG |
|
Stf07, MBP7 | 10 mM | 1:1 MeCN/H2O, 0.1% (wt/vol) TFA, 1 h followed by lyophilization |
| AO-Alexa Fluor 488 |

|
IgG6, mouse-CD4 (ref. 6) | 300 μM | 100 mM MES, pH 5.5, 37 °C, 2 h (in vitro) 50 μM, 10% (vol/vol) FBS in PBS, pH 6.4, 1 h (cell culture) |
| 1 AO-glycan |
|
hGH9 | 1 mM | 5% (vol/vol) MeCN, 0.02% formic acid or, 5% MeCN, 50 mM sodium citrate |
| AO-azide |

|
hIgG10, MBP10, hGH10 | 0.2–1 mM 10–20 equiv. | 100 mM KOAc, pH 4.6, 16 h, 35 °C |
| AO-DIBAC |

|
hIgG10, MBP10 | 0.2–1 mM 10–20 equiv. | 100 mM KOAc, pH 4.6, 16 h, 35 °C |
