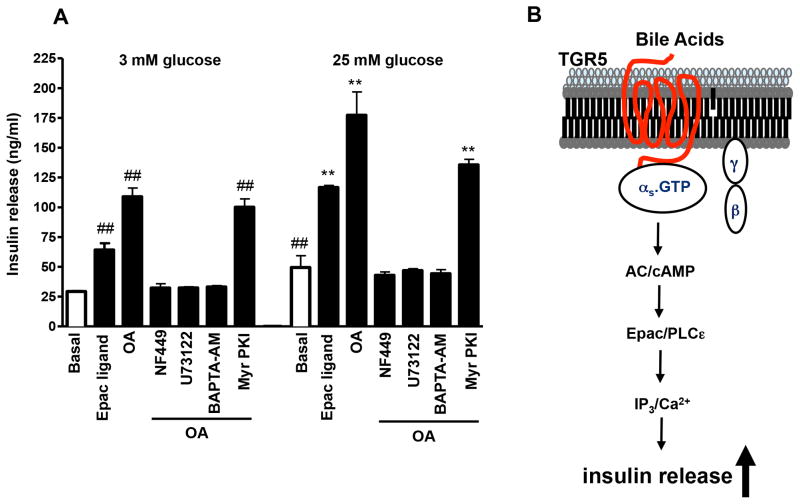
Figure 4. (A) Effect of Gs and PI hydrolysis inhibitors on OA-induced insulin release.
MIN6 cells were treated with the Epac ligand, 8-pCPT-2′-O-Me-cAMP (1 μM), or OA (50 μM) in the presence or absence of NF449 (10 μM), U73122 (10 μM), BAPTA-AM (10 μM) or myristolylated PKI (1 μM). After 30 min, the supernatant was collected and used to measure insulin levels by ELISA. Values are expressed as mean ± SEM of 3 experiments. ##p<0.01 vs. 3 mM glucose basal; **p<0.01 vs. 25 mM glucose basal. (B) Schematic representation of the signaling pathway coupled to TGR5 receptors to mediate insulin release from pancreatic β cells.

