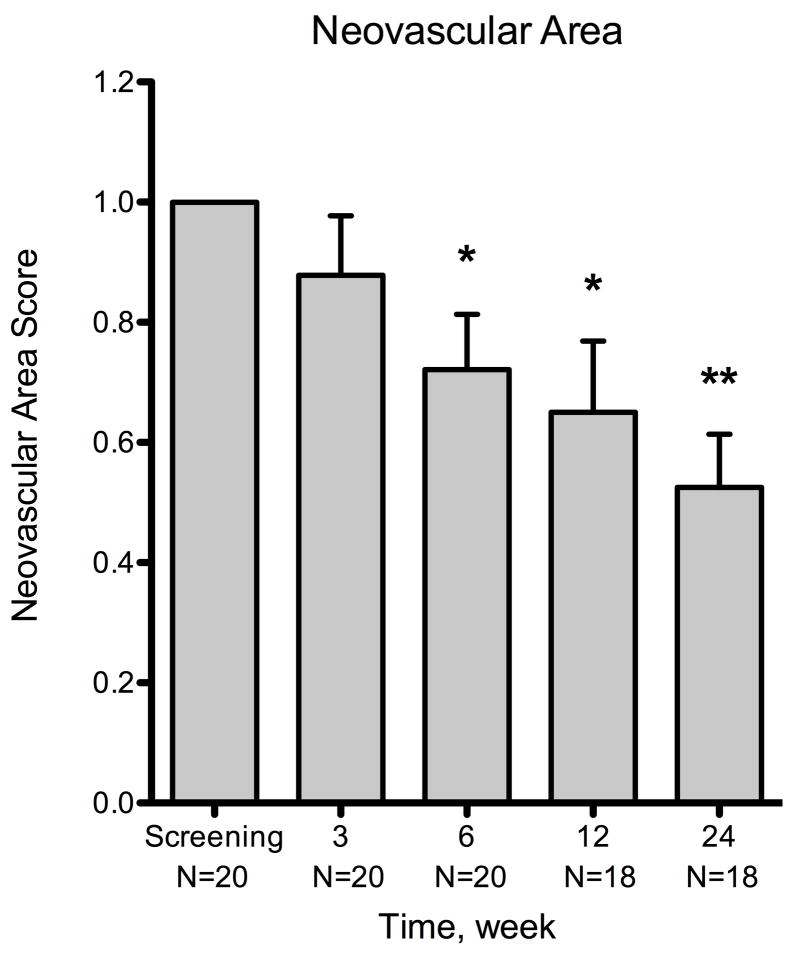
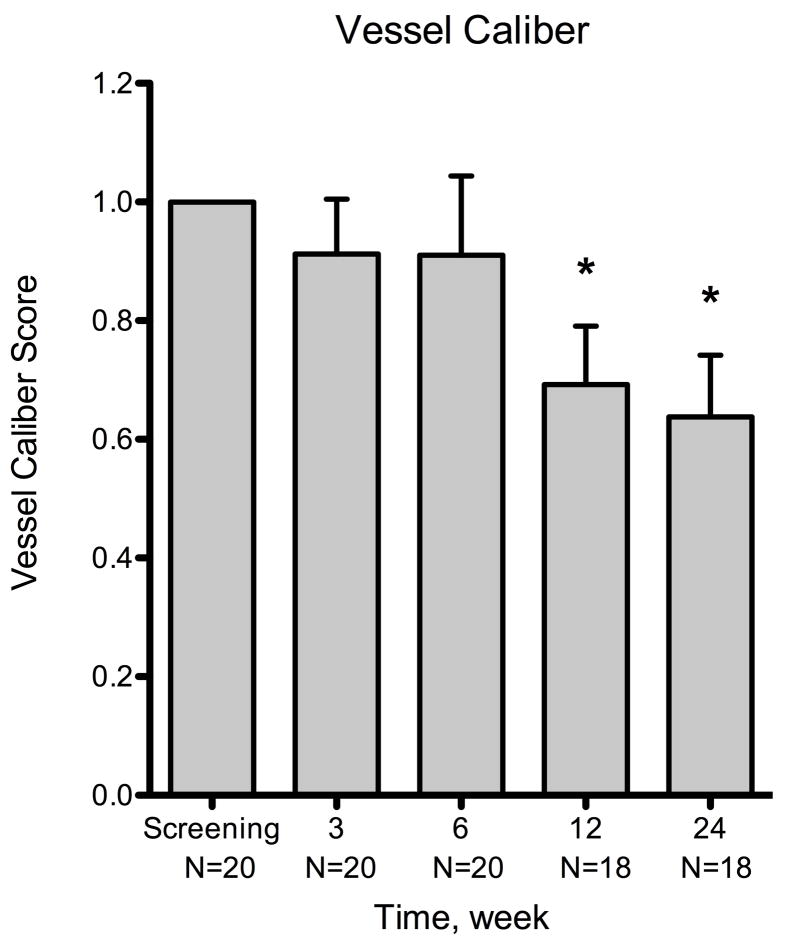
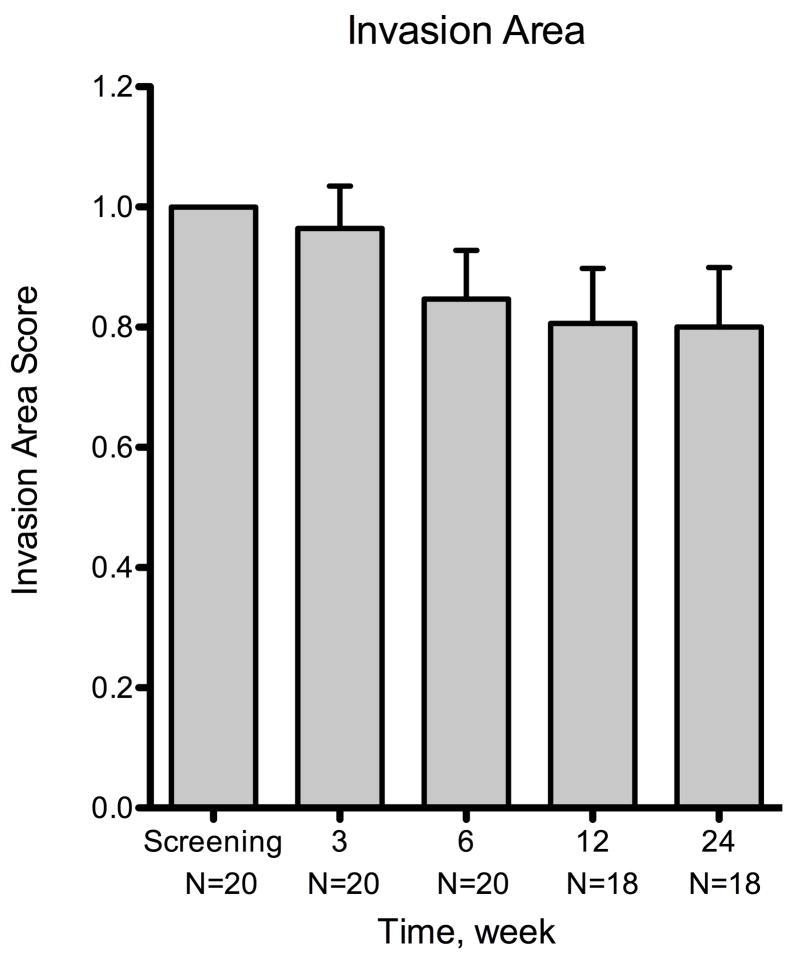
Figure 2.
Summary of changes for all patients at various time points using three metrics of corneal neovascularization. The metrics used were: neovascular area, vessel caliber, and invasion area. Compared to the baseline visit, the neovascular area showed statistically significant decrease at week 6 (P = .007) and the vessel caliber at week 12 (P = .006). By week 24, the mean changes were −47.5% ± 8.8% (n = 18) for neovascular area, −36.2% ± 10.4 (n = 18) for vessel caliber, and −20.0% ± 9.9% (n = 18) for invasion area. The decreases in neovascular area and vessel caliber were statistically significant (P < .001 and P = .003, respectively), but invasion area was not (P = .06). Error bars represent SEM (standard error of mean). * P < .05, ** P < .001


