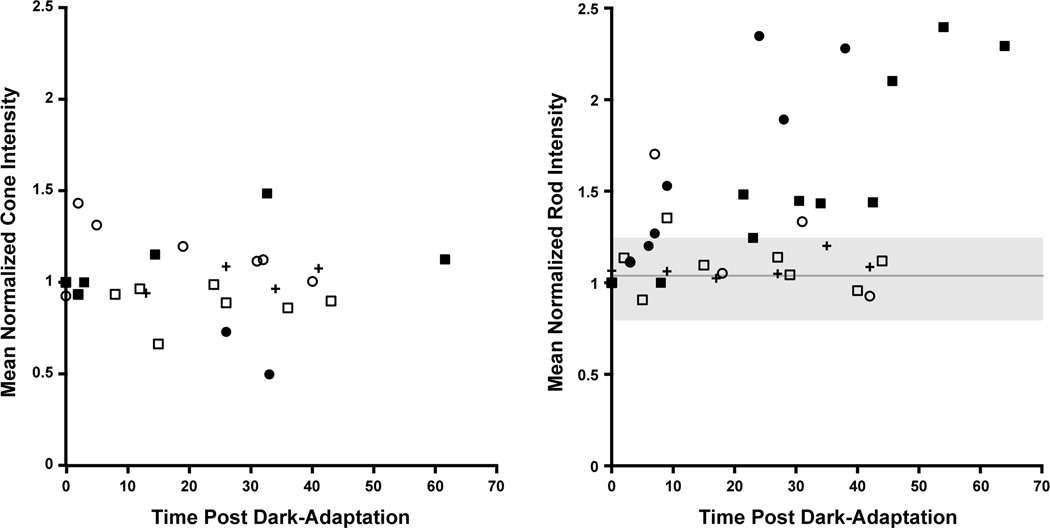
Figure 7.
Plot of photoreceptor intensity as a function of time after removal from dark adaptation for 2 patients with complete congenital stationary night blindness caused by GRM6 mutations, 2 brothers with Oguchi disease caused by GRK1 mutations, and 1 normal control. Mean intensity for parafoveal cones (left) and perifoveal rods (right) is shown for the five patients. An average of 1,589 cones and 1,047 rods were analyzed per subject. As seen on the left, mean cone intensity was variable, but no clear trends were visible across the subjects. The mean ± SD of the cone intensity values across all subjects are plotted on the right as the solid gray line and shaded gray region, respectively. Generally, the mean rod intensity varies within this region for the two complete congenital stationary night blindness patients and the normal control, while a systematic increase in the mean rod intensity is observed for the two brothers with Oguchi disease. Filled symbols are the brothers with Oguchi disease (DH_0491, filled circles; DH_0819, filled squares), open symbols are the complete congenital stationary night blindness patients (JC_0682, open circles; JC_0684, open squares), and the crosses are the normal control (JC_0677).

