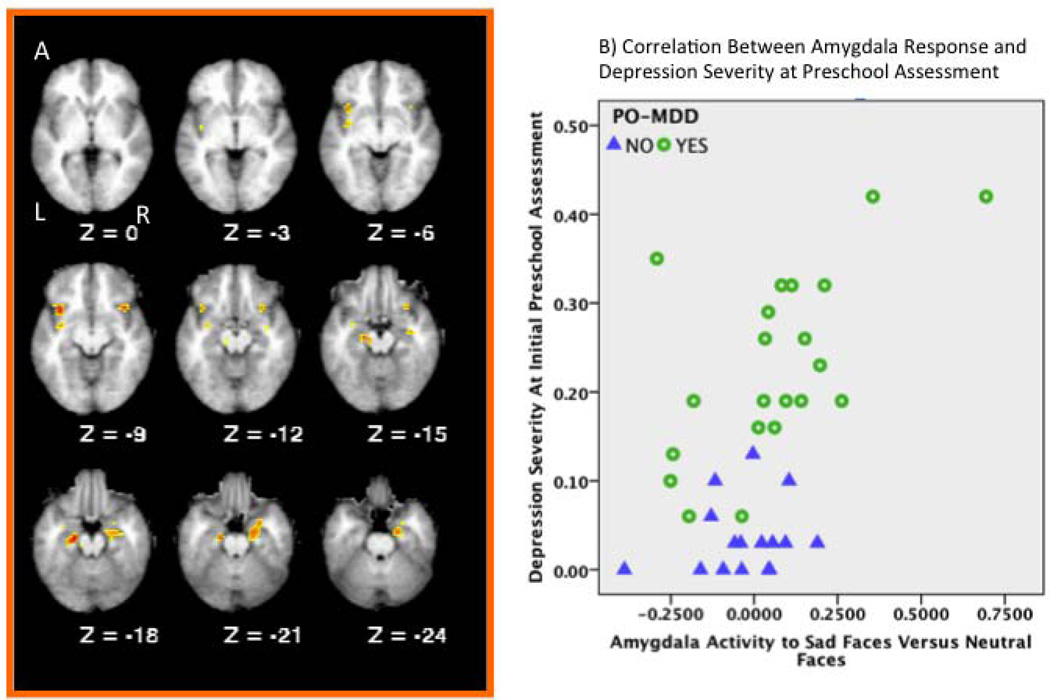
Figure 2.
Results of a priori ROI analyses examining the correlations between depression severity at the baseline preschool assessment and functional brain response to sad faces. A) Brain slices illustrating regions showing regions displaying significant correlations between functional brain responses to sad versus neutral faces and the severity of depression at the initial preschool assessment. Z values represent millimeters above or below the line bisecting the anterior and posterior commissures. B) Scatter plot illustrating the correlation in the amygdala between functional brain responses to sad versus neutral faces and the dimensional assessment of depression severity at the initial preschool assessment. Blue triangles indicate healthy control children and green circles indicate children with a history of PO-MDD.

