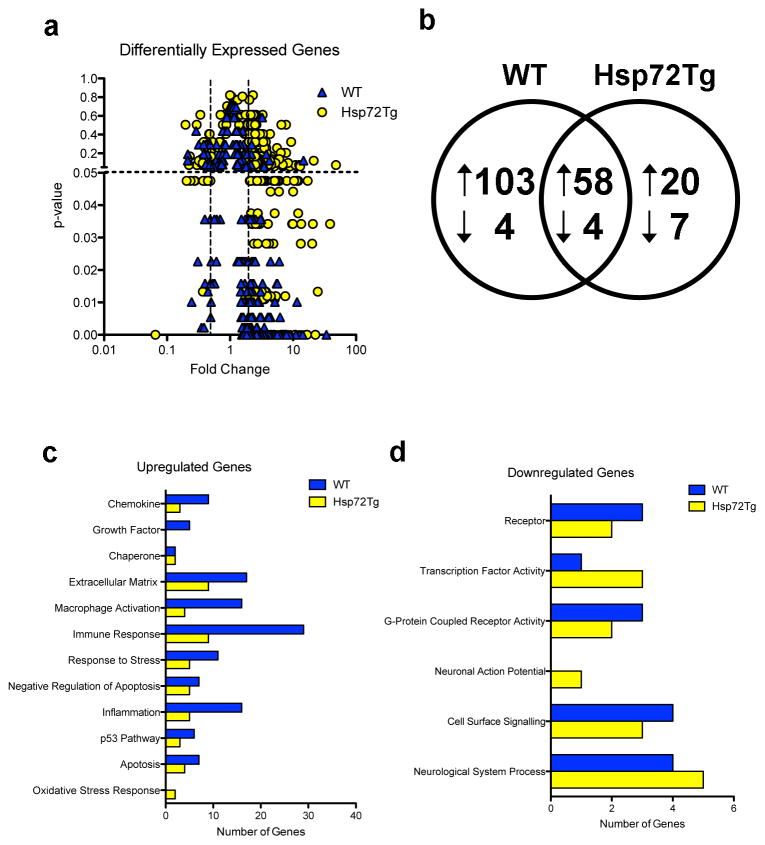
Figure 1.
Changes in gene expression 24h following MCAO in Hsp72Tg and WT mice. (a) Volcano plot showing genes up- or down-regulated at least 2-fold in either genotype, with p-value on the Y axis and fold change on the X axis. Dotted lines represents statistical cut-off at p < 0.05 and fold change at ≥ 2 and ≤ 0.5. (b) MCAO induces overlapping sets of genes in WT and Hsp72Tg mice. Venn diagram showing differentially regulated genes for each genotype, MCAO compared to sham. Arrows indicate the direction of change. (c–d) Over-represented gene ontology categories for the upregulated (c) and downregulated (d) genes. For each category and genotype, the number of genes is shown.

