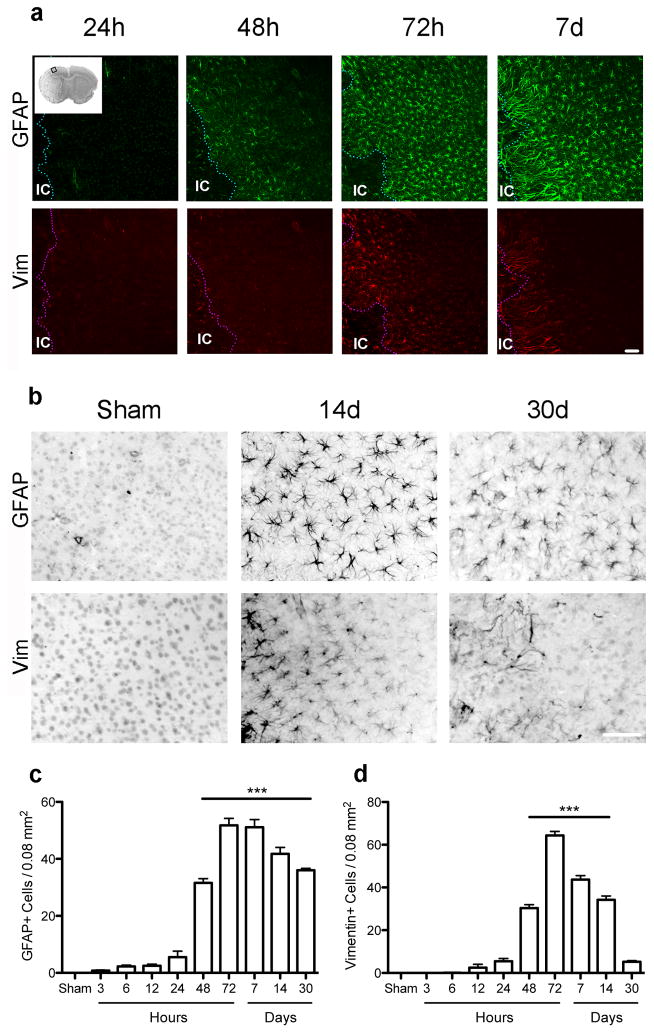
Figure 2.
Time course analysis of number of GFAP and Vim immunoreactive cells in the cortical penumbra through 1 month. (a) Low power view of GFAP and Vim expression in the cortical penumbra up to 1 week after stroke. Inset in top left image shows a cresyl violet stained section with a square indicating the cortical area where cell counting was performed. IC=ischemic core. (b) Representative micrographs show the relative number of cells per area at days 14 and 30. (c–d) Changes in the number of GFAP (c) and Vim (d) immunopositive cells varied through 30 days after injury. ***p<0.001 versus Sham. Scale bar = 50 μm. Graph shows mean +/− SEM.

