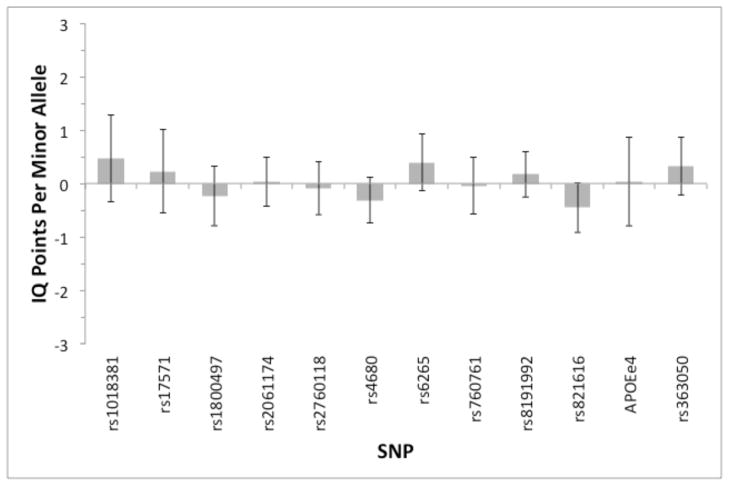
Figure 2.
Regression coefficients for each genotype (i.e., difference in number of IQ points associated with each copy of the minor allele), pooled across Studies 1–3. To minimize the variance of the estimator, pooling was done by weighting the three estimated regression coefficients for each SNP by the inverse of their estimated variances, with the weights then normalized so that they sum to one. Error bars show 95% confidence intervals. For APOE, the bar shows the number of IQ points associated with possessing at least one e4 allele.

