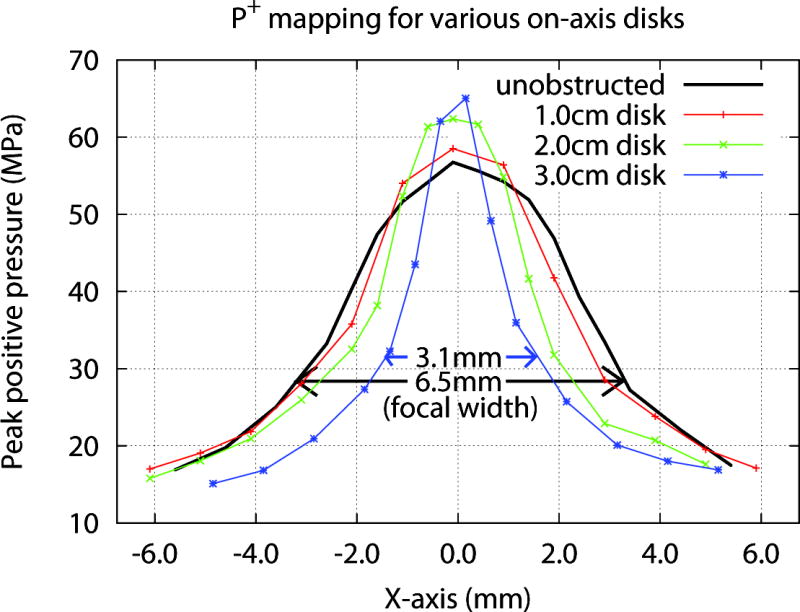
Figure 5.

Pressure (P+) mapping at the focal plane for on-axis defects of various sizes. Note that a 3.0 cm defect cut the focal width to less than half (~3.1 mm) compared to when coupling was unobstructed (~6.5 mm). Peak negative pressure (P− not shown) measured −4.1±0.4, −3.1±0.8, and −2.8±0.5 MPa for unobstructed coupling, and 2.0, 3.0 cm disks, respectively.
