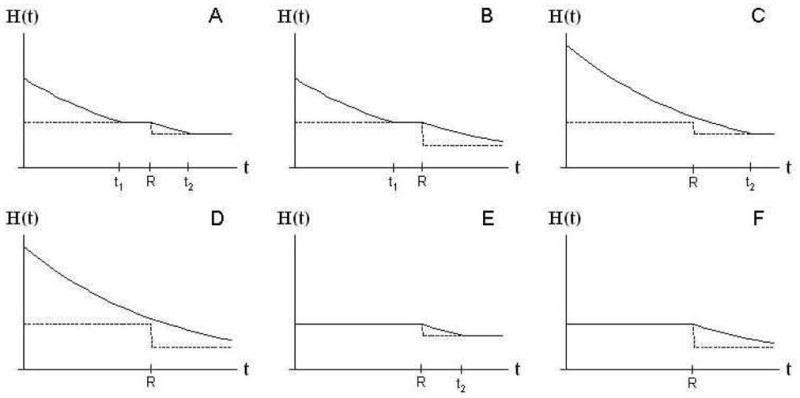
Figure 1.

Six scenarios for the evolution of health. t1 and t2 denote the ages at which health (solid line) has evolved towards the health threshold (dotted line), and R denotes the age of retirement. The health threshold drops at the age of retirement R as a result of differences in utility due to increased leisure time during retirement (depending on the value of k, leisure is a substitute or a complement of consumption and health) and because health has no effect on income after retirement (ϕ(t) = 0).
