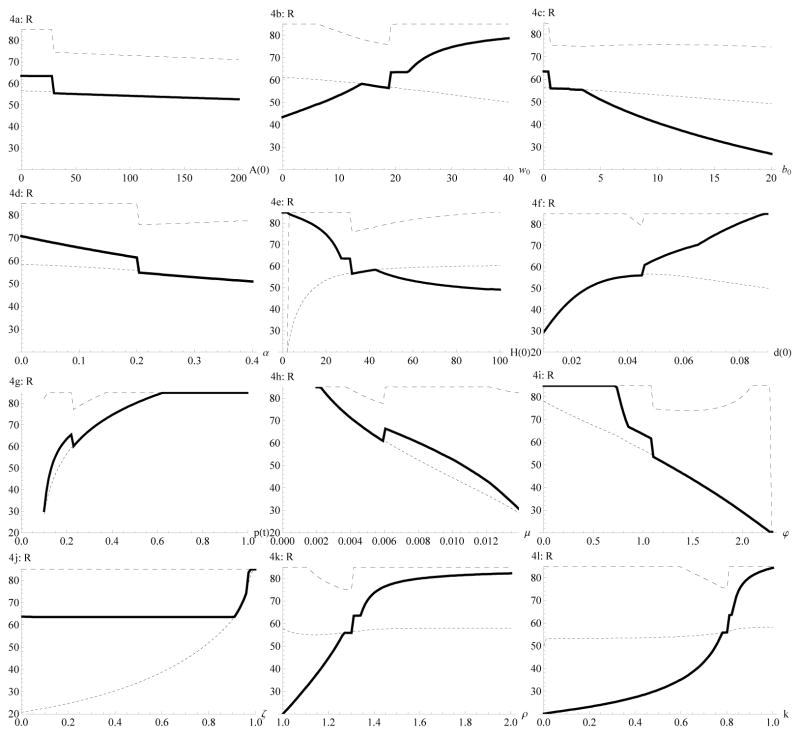
Figure 4.
The effect of various variables and parameters on the decision to retire. Initial assets A(0), base wage rate w0, benefits b0 are shown in $ thousands, and initial health H(0) in $ thousands. Note: values for health deterioration d(t) < 0.005, prices p(t) < 0.088, health investment efficiency μ > 0.016, and marginal production benefits of health ϕ > 2.29 are not shown as they correspond to a user cost of health capital at the margin [p0/μ0] [d0 + δ] − ϕ0 that is negative. Values of ρ < 1 and k > 1 are not shown as these require a change in specification; for ρ = 1 the utility function switches from being negative (ρ > 1) to positive (ρ < 1) values. For positive utility, values of k < 1 imply disutility from increased leisure, i.e. we need to also switch to values of k > 1.

